Color Detection in Images using MATLAB

Hello friends, hope you all are fine and having fun with your lives. In today's tutorial, we are gonna see Color Detection in Images using MATLAB. In the previous tutorial, I have posted about How to Detect Circles in Images using MATLAB in which we have detected objects based on their geometrical figure means either they are circle or not but today we are gonna distinguish objects based on their color i.e. whether they are red colored or green colored etc. Its a quite simple tutorial and comes in the basic category. We will first detect the color and then will create a boundary around that object and will also show its XY coordinates as well.

Image processing is an important tool of MATLAB. We can quite easily do the image processing in it using Image Processing toolbox so you need to make sure that your MATLAB must have Image processing toolbox before running this code. You should also have a look at these MATLAB Image Processing Projects. So, let's start with the project.

Color Detection in Images using MATLAB

  • In order to do the Color Detection in Images using MATLAB, first thing we are gonna need is the image itself. :P
  • So, I designed an image in paint which has different shapes in different colors as shown in below figure:
  • As you can see in the above figure, there are different shapes in different colors so now we are gonna detect these objects on the basis of their color.
  • Now use the below code and add it in your MATLAB m file, if you are new to m File then have a look at How to Create m File in MATLAB.
  • If you wanna protect your code in m File then you should read How to Protect code in m File.
    data = imread('TEP.jpg');
    diff_im = imsubtract(data(:,:,2), rgb2gray(data));
    %Use a median filter to filter out noise
    diff_im = medfilt2(diff_im, [3 3]);
    diff_im = im2bw(diff_im,0.18);
    
    diff_im = bwareaopen(diff_im,300);
    
    bw = bwlabel(diff_im, 8);
    
    stats = regionprops(bw, 'BoundingBox', 'Centroid');
    
    % Display the image
    imshow(data)
    
    hold on
 
    for object = 1:length(stats)
        bb = stats(object).BoundingBox;
        bc = stats(object).Centroid;
        rectangle('Position',bb,'EdgeColor','r','LineWidth',2)
        plot(bc(1),bc(2), '-m+')
        a=text(bc(1)+15,bc(2), strcat('X: ', num2str(round(bc(1))), ' Y: ', num2str(round(bc(2)))));
        set(a, 'FontName', 'Arial', 'FontWeight', 'bold', 'FontSize', 12, 'Color', 'black');
    end
    
    hold of
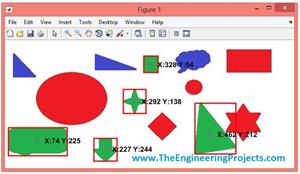
  • Now, run your m file and if everything goes fine then you will get an image as shown in below figure:
  • You can see in the above figure, we have only detected the shapes with green color.
  • The + sign indicates the center of each detected shape.
  • X and Y are the x,y coordinates of the center point of each shape which are shown in black for each detected shape.
  • Now, let's detect the red color in above figure, so in order to do so what I need to do is to simply change the third value in imsubtract function from 2 to 1.
  • The complete code for red color detection in MATLAB is shown below:
    data = imread('TEP.jpg');
    diff_im = imsubtract(data(:,:,1), rgb2gray(data));
    %Use a median filter to filter out noise
    diff_im = medfilt2(diff_im, [3 3]);
    diff_im = im2bw(diff_im,0.18);
    
    diff_im = bwareaopen(diff_im,300);
    
    bw = bwlabel(diff_im, 8);
    
    stats = regionprops(bw, 'BoundingBox', 'Centroid');
    
    % Display the image
    imshow(data)
    
    hold on
 
    for object = 1:length(stats)
        bb = stats(object).BoundingBox;
        bc = stats(object).Centroid;
        rectangle('Position',bb,'EdgeColor','r','LineWidth',2)
        plot(bc(1),bc(2), '-m+')
        a=text(bc(1)+15,bc(2), strcat('X: ', num2str(round(bc(1))), ' Y: ', num2str(round(bc(2)))));
        set(a, 'FontName', 'Arial', 'FontWeight', 'bold', 'FontSize', 12, 'Color', 'black');
    end
    
    hold off
  • Now, when you run this code in MATLAB, you will get the output as shown in below figure:
  • Now instead of detecting the green shapes, it has now detected the red shapes in MATLAB.
  • And have also shown their x,y coordinates in black color.
  • Now, finally let's detect the blue color, in order to do, you now just need to change the third parameter to 3 and it will detect the blue color as shown in below figure:
  • That's all for today, and I think its quite an easy one as I mentioned earlier this one is quite basic tutorials. Thanks for reading and I hope it will help you in some ways. :)
Syed Zain Nasir

I am Syed Zain Nasir, the founder of <a href=https://www.TheEngineeringProjects.com/>The Engineering Projects</a> (TEP). I am a programmer since 2009 before that I just search things, make small projects and now I am sharing my knowledge through this platform.I also work as a freelancer and did many projects related to programming and electrical circuitry. <a href=https://plus.google.com/+SyedZainNasir/>My Google Profile+</a>

Share
Published by
Syed Zain Nasir