Hello pupil! We hope you are doing well with object-oriented programming with Python. OOP is an extremely important topic in programming, and the good thing about Python is that the concept of OOP can be implemented in it. In the previous lecture, we made a basic introduction to all the elements that are used in the OOP, and right now, we are moving forward with the detail of each concert with examples. The imperative nature of the OOP is useful for us because it uses the statements to change the programming state, and in this way, the working of the code becomes easy and effective. To use the applications of Python, the imperative nature of OOP will give us the tools we need to get the perfect results by using our creativity. We will prove this in just a bit, but here are the highlights o ...
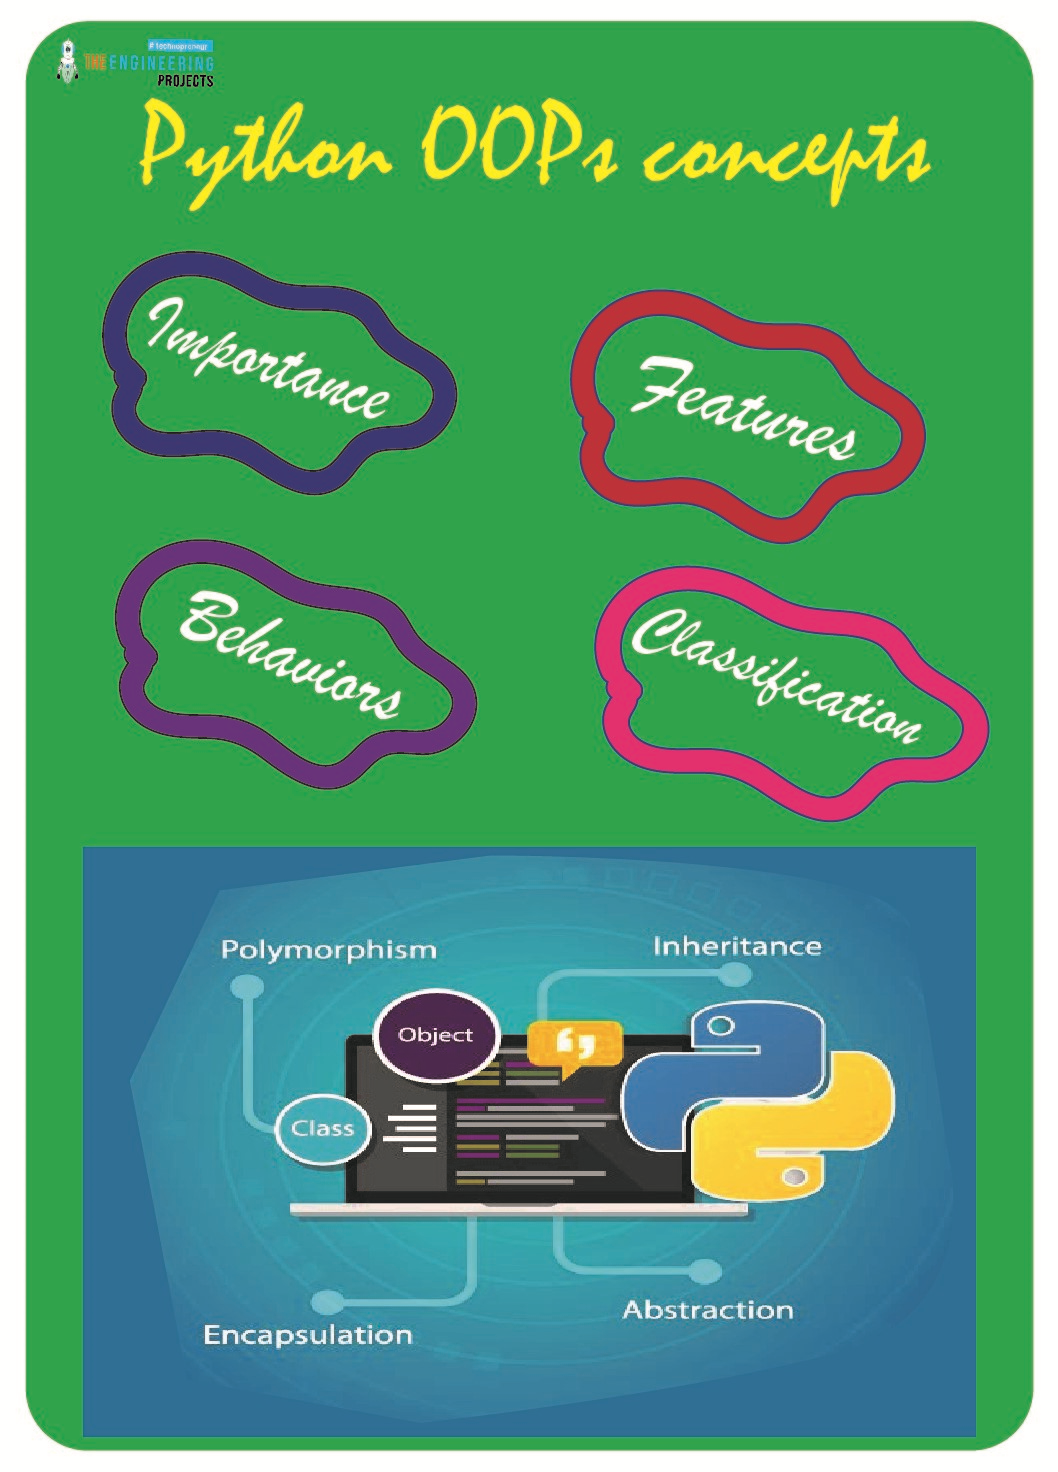
Hey peeps! Are you excited to begin with the new chapter in Python? Till now, we have been learning the data types and their related concepts. Now, we are starting a new chapter where you will learn the details of Object Oriented Programming or OOP. We are moving towards the advanced level of programming in Python, and here, you will go through the complex but interesting concepts that will show us the fascinating results on the screen. This will be more clear when you will know the basic information about the OOP, but before going deep, we will go through the headlines of the lecture:
How do you classify the programming languages?
How do you introduce the OOP?
Why object-oriented programming is important in Python?
How do you define class and objects in OOP and how are they connected? ...
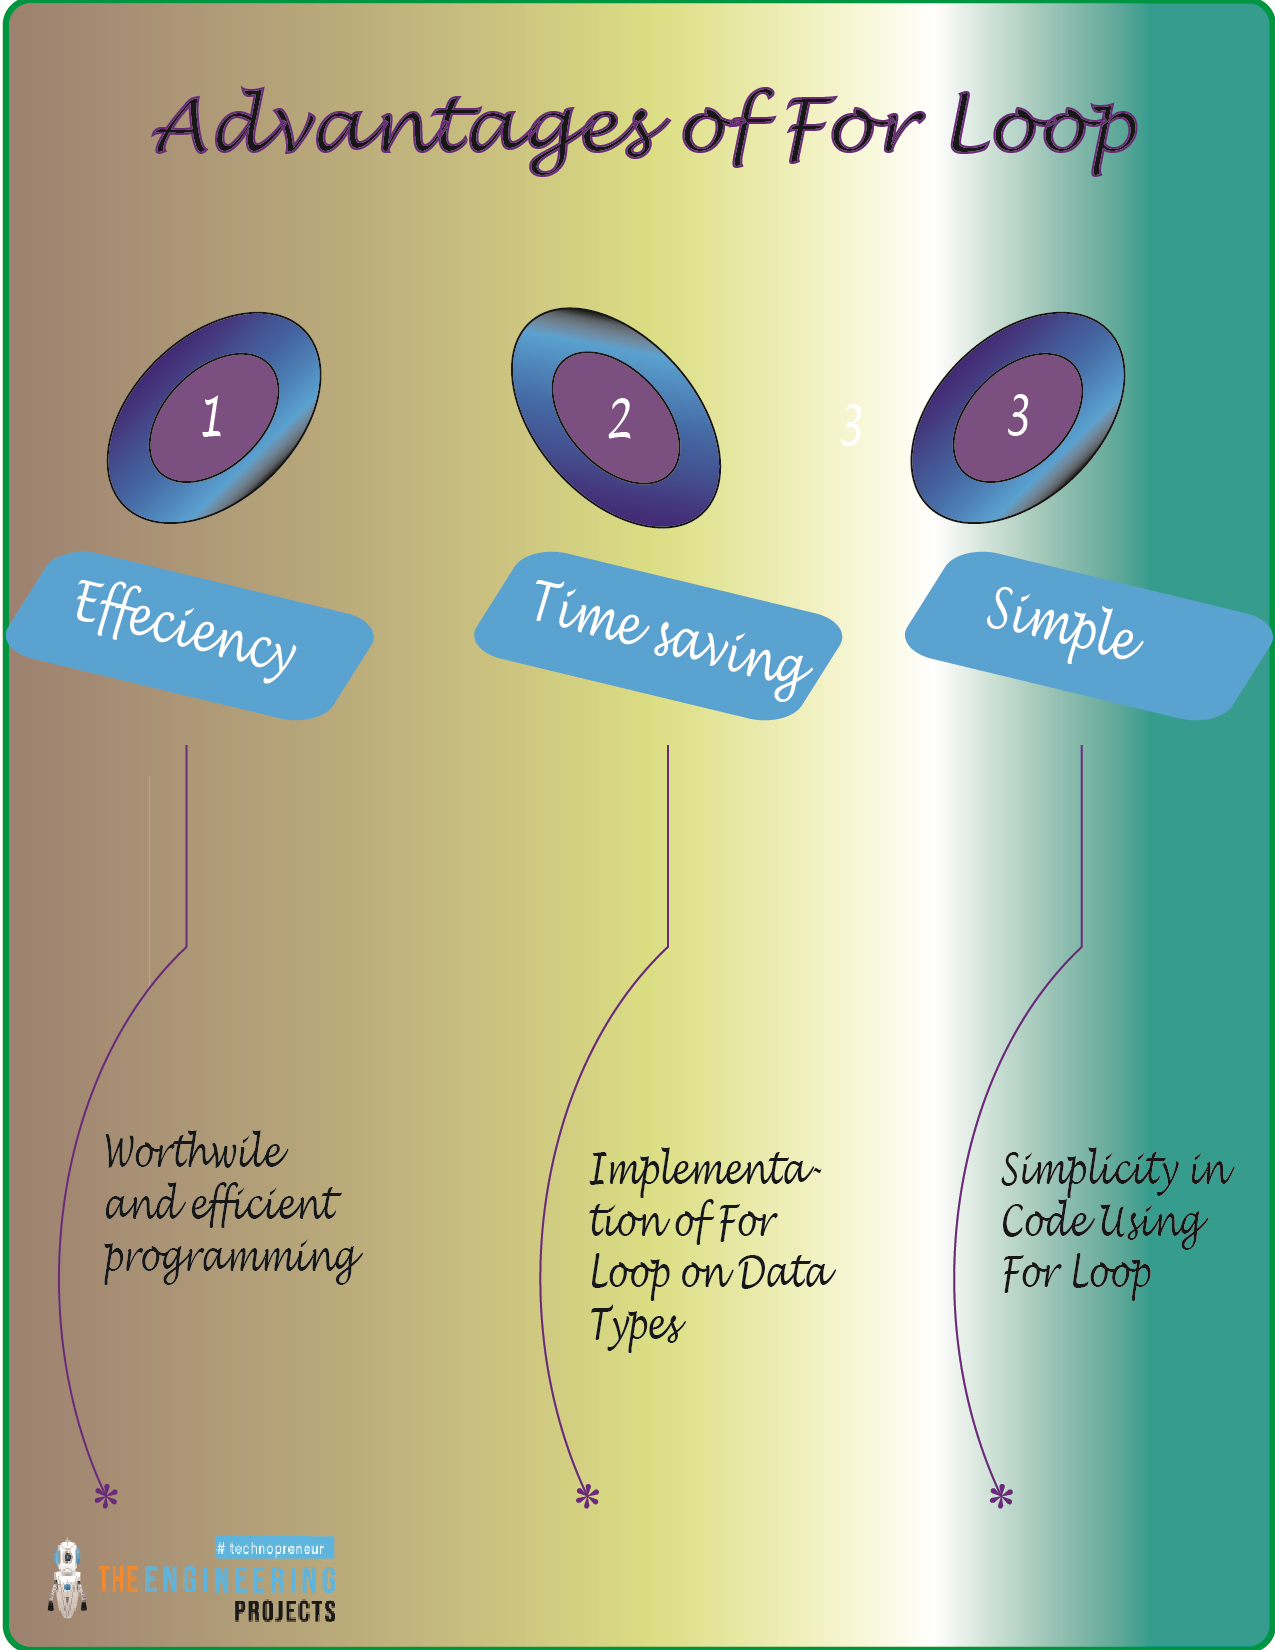
Hey peeps! Welcome to the new tutorial for the Python programming language, where we are at the point where we are going to learn about the loops. Loops are fundamental concepts in programming, and if we talk about Python, there is a smaller variety of loops in it, but the most important ones are available to practice in Python. In the last session, there was a long discussion about the while loop in detail. We had seen some examples and the details of the statements that can be used within the while loop. In the present lecture, we are going to discuss the second type of loop in Python, that is, the for loop. You will go through the training of every important and basic step about this loop, but first of all, you have to look at the basic list:
Why do we prefer for loop over some other c ...
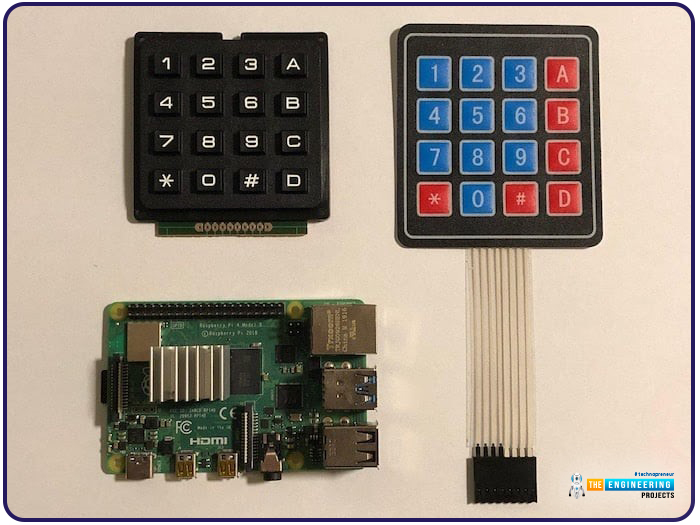
Hello friends, I hope you all are doing well. Welcome to the next tutorial of our Raspberry Pi 4 programming course. In the previous lecture, we interfaced LCD 16x2 with Raspberry Pi 4. Today, we will interface a keypad 4x4 to Raspberry Pi 4. In embedded projects, a keypad is used to get user input i.e. calculator, ATM keypad etc. Different types of Keypads are available i.e. 4x4, 4x3 etc.
So, let's get started:
Components Required
We will need the following components in our today's project:Raspberry Pi 4Keypad 4x4BreadboardConnecting Wires
Keypad 4x4
A keypad is a collection of push buttons, arranged in a matrix form.Keypad 4x3 means the keypad has 4 rows and 3 columns and 12 buttons in total. A 4 by 4 keypad membrane has 8 pins in t ...
Data-driven design is a powerful tool that can help you create an effective product. By leveraging data to inform your decisions, you can ensure that the design of your product will be tailored to meet user needs and preferences. This in turn leads to increased engagement and satisfaction among users, as well as more successful products overall. In this article, we'll look at how to use data to inform your product design decisions – from understanding your data sources and analyzing user behavior & feedback all the way through refining the design based on feedback and results. With these tips in hand, you'll be well-equipped to create a successful product with a great user experience.
1. Understand Your Data Sources
Comprehend Your Information Sour ...
Cryptocurrency trading is a popular way to get started with cryptocurrency. It's also a great way to multiply your funds if you're an experienced trader. In this post, we'll give you the basics of how cryptocurrency exchanges work and help you choose an exchange.
What is Cryptocurrency Trading?
Cryptocurrency trading is the process of buying and selling cryptocurrency on an exchange. Cryptocurrencies are digital assets that can be exchanged for other cryptocurrencies, for example, you can exchange eth for sol
, or for fiat currency (US dollars).
You can use a cryptocurrency exchange to trade your coins, or you can buy them directly from another person. Some exchanges offer both options: they allow users who want to trade coins with one another and also serve as platforms where people ...
Data science is a rapidly growing field that is revolutionizing the way businesses and organizations operate. With the explosion of data in recent years, there is a high demand for professionals who can analyze, interpret, and make decisions based on large amounts of complex data. Pursuing a degree in data science can provide you with a variety of benefits, including high-demand job opportunities, diverse skill sets, strong problem-solving skills, interdisciplinary learning, and the ability to innovate. Some of the key benefits are explained below.
High Demand
Obtaining a degree in data science is a smart career move, especially considering the high demand for qualified professionals in this rapidly growing industry. One of the most significant b ...
The choice of operating system for a virtual private server depends on the needs of a particular company. But if you are looking for a reliable, efficient, and flexible solution to host your web projects, in most cases it will be Windows VPS. In this article, we'll analyze why many people prefer Microsoft solutions, and what benefits and limitations you can expect if you decide to buy a Windows VPS
.
What is a Windows VPS and what it is used for?
Windows VPS is a virtual private server that uses Windows Server as the underlying operating system. Windows VPS functions effectively as a cloud server with elastic scalability. This means that you get a dedicated server resource that you can use as you see fit, and you can easily add resources as ...
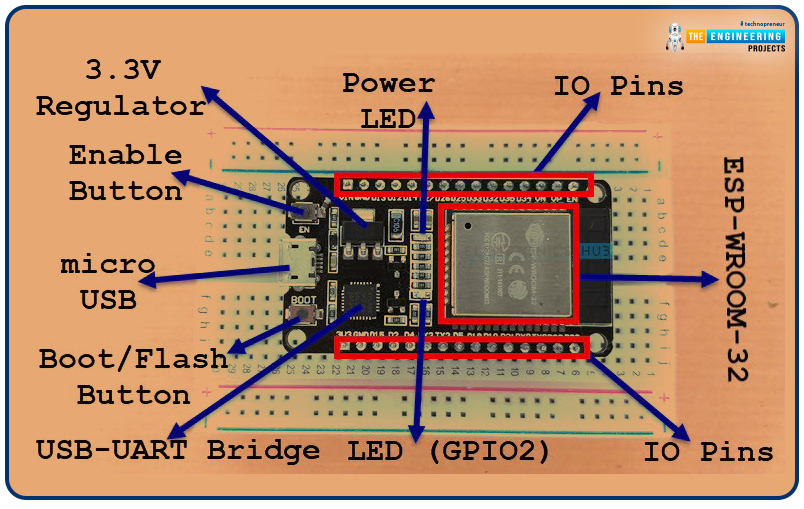
Welcome to the next tutorial of our raspberry pi 4 programming course. A previous article covered connecting a Remote Control Radio Frequency Module (433 MHz) to a Raspberry Pi 4. To turn things on and off wirelessly, we programmed a Raspberry Pi 4 to act as a radio-frequency (RF) remote control. However, this guide will study how to wirelessly pair a Raspberry Pi 4 and an ESP32. After reading this article, you'll get a good grounding in the fundamentals of Bluetooth module operation between two ESP32 and Pi 4 communication.
When it comes to sharing data over short distances using Ultra High-Frequency Radio Waves, Bluetooth is one of the most reliable and effective short-range wireless communication solutions. Since Bluetooth Technology was initially conceived as a cable substitution tech ...
Customers are becoming increasingly savvy and demanding in this ever-evolving and competitive world. Businesses need to include relevant content in all of their public interactions if they want to keep them happy and keep their business.
To be considered a complete suite, these businesses would require mobile applications, paperless forms, online communities, and other complementary applications in addition to comprehensive content management solutions for building their websites.
If this is the case, professionals will have an easier time keeping track of their content and assets and will be able to send them to the right people at the right time. The Adobe Experience Manager, is one such option, which we'll go over in detail.
What is Adobe Exp ...