Hi, friends I hope you are all well this topic we can discuss the main concept of velocity, the velocity time graph. Understanding how things move is key in physics, and velocity-time graphs play a big role in this study. These graphs show how fast an object is going at different times giving us an easy way to look at things like speed changes, distance travelled, and the pushes or pulls involved. For college students, getting good at reading and using these graphs matters a lot. It helps them do well in class and gives them a better grasp of the rules controlling how stuff moves in the world around us.
velocity-time graphs have many uses: they help scientists and engineers model how objects move, guess where they'll be later, and study how different forces affect them. Looking at the graph's shape and steepness tells us if something is speeding up, slowing down, or going at the same speed. This isn't just book learning; it has real-world uses in areas like car design where knowing how cars speed up and slow down can lead to safer and better-performing vehicles.
VELOCITY:
The velocity of an object is the speed and direction in which it moves. Velocity is a fundamental idea in kinematics, which is an area of classical mechanics that describes how bodies move.
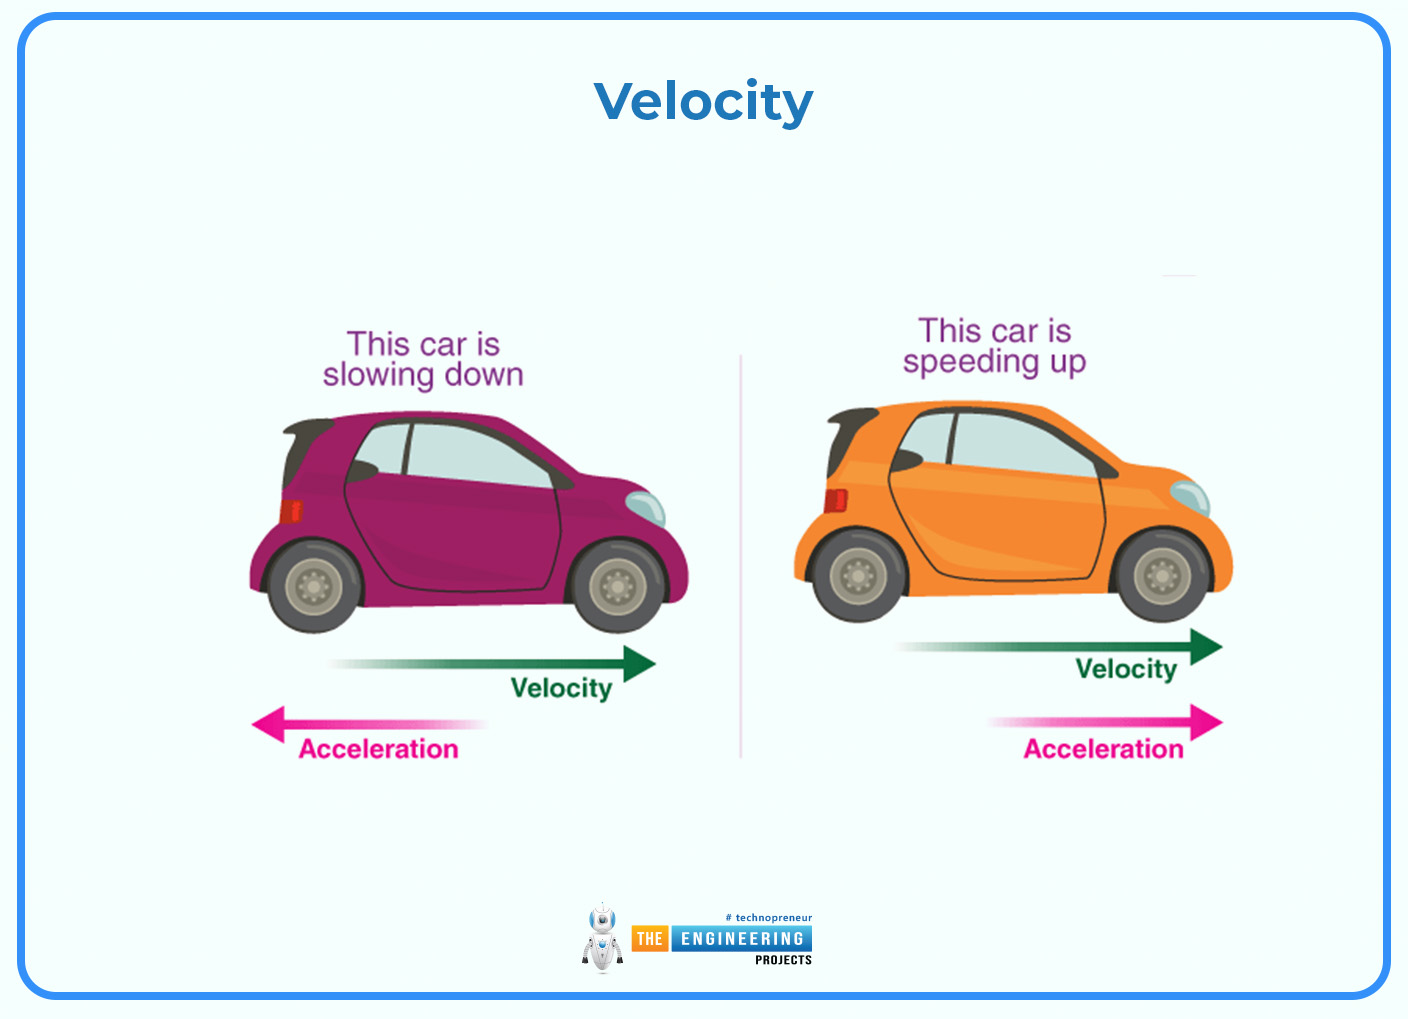
Due to its vector nature, velocity possesses both magnitude and direction. The speed in a specific direction has the name velocity. Speed, meanwhile, refers to the scalar absolute value (magnitude) of velocity. A derived unit of measurement in the International System is a coherent system expressed as (m / s or ms −1). This is a scalar just like 5 metres per second, but it makes this vector if it has direction, like 5 m/s east. If an object speeds up, slows down, or changes direction, it is said to be accelerating.
AVERAGE VELOCITY:
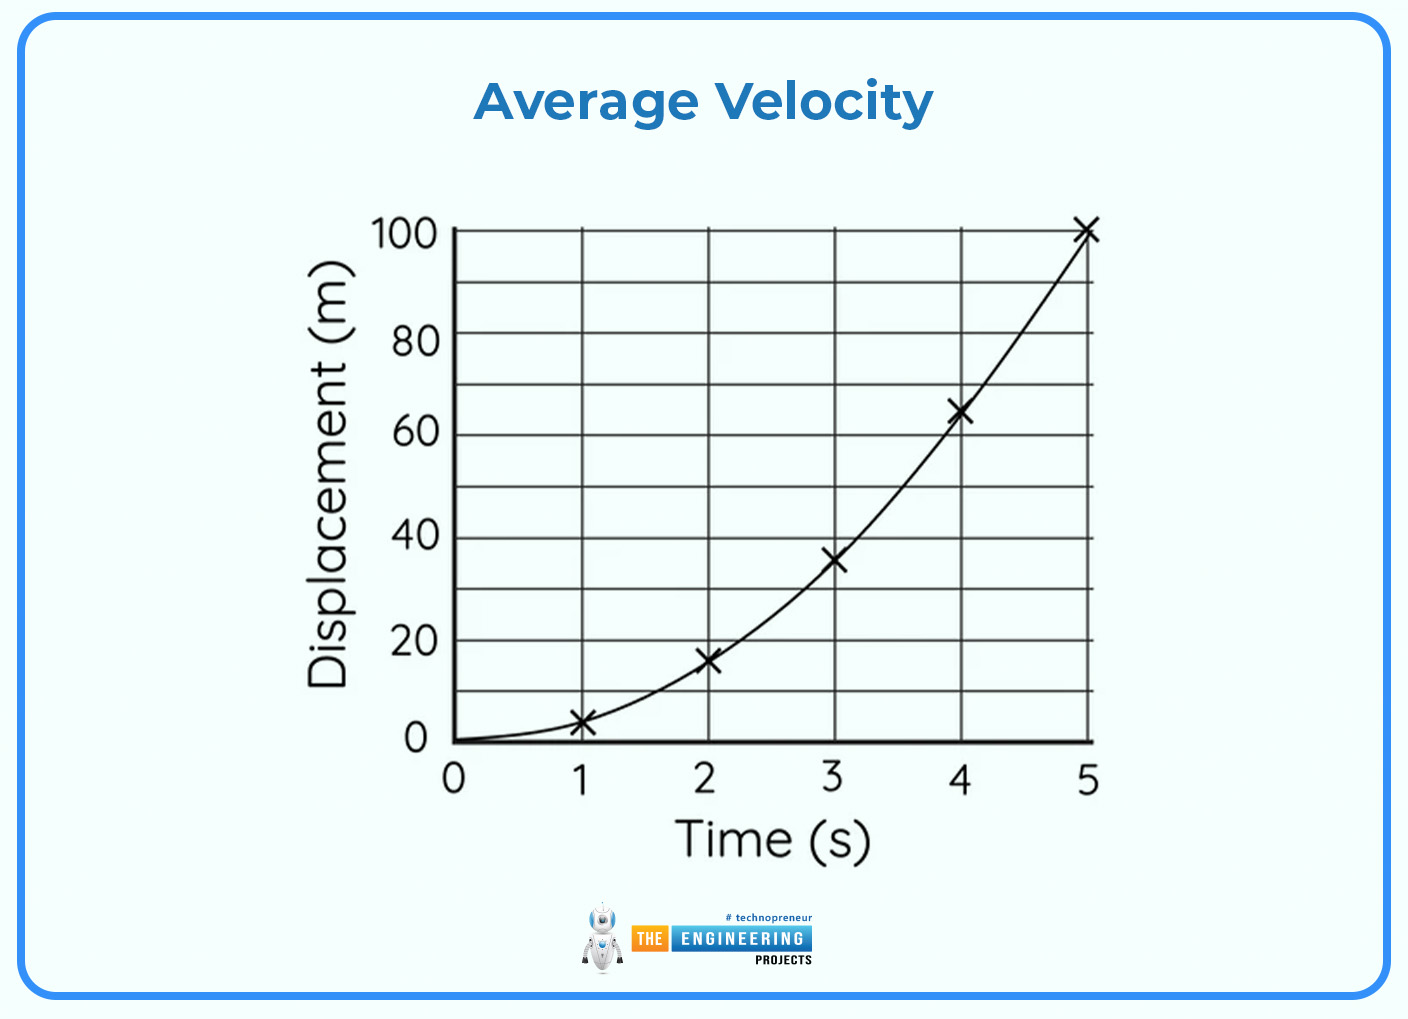
Average Velocity is defined as the rate of change of position ( s) concerning time ( t), Average velocity can be calculated as:
𝑣¯= Δ𝑠/Δ𝑡.
INSTANTANEOUS VELOCITY:
if an object has a limited average velocity when the time interval approaches zero, is known as instantaneous velocity. At any particular time t, it can be calculated as the position derivatives concerning time.
𝑣 = limΔ𝑡→0 Δ𝑠/Δ𝑡 = 𝑑𝑠/𝑑𝑡.
We concluded from this equation that, the area under a velocity-time graph is the displacement (s) that is seen in the one-dimensional case. The displacement function s(t) is the integral of the velocity function v(t), to put it mathematically. This is shown by the yellow region beneath the curve in the visual representation.
s = v dt
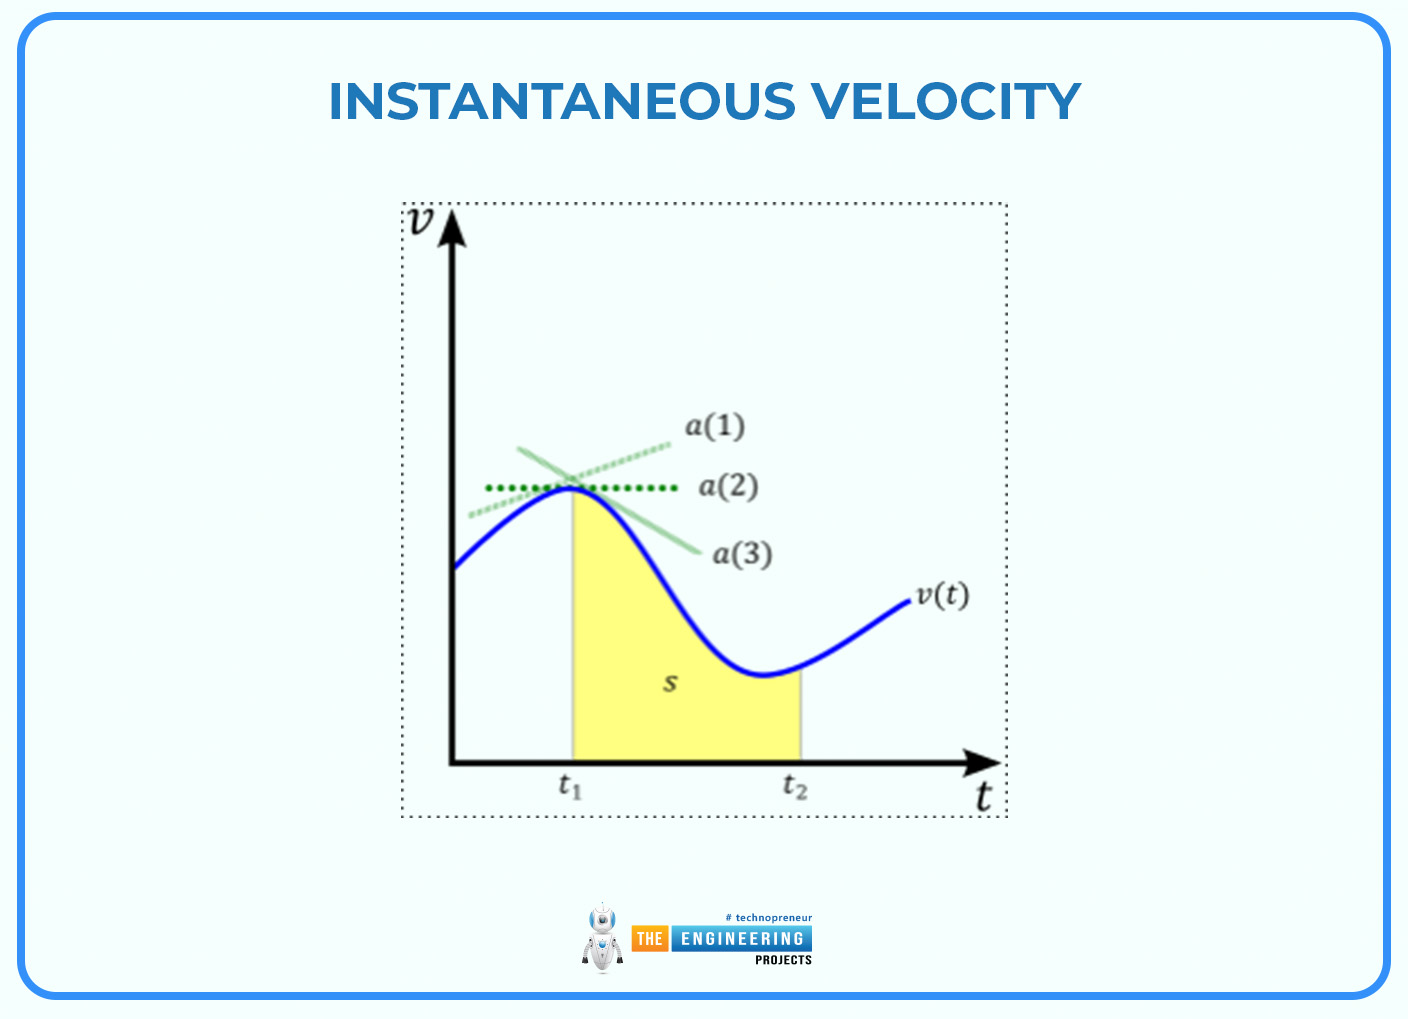
A visual representation of a velocity versus time graph showing the link between displacement s, acceleration a (shown by the three green tangential lines that appear at various places along the curve representing the acceleration values), and velocity v on the y-axis.
Though it may seem contradictory at first, an instantaneous velocity can be conceptualised as the speed at which an item would continue to travel even if it stopped moving at that particular time.
BASICS OF VELOCITY-TIME GRAPHS:
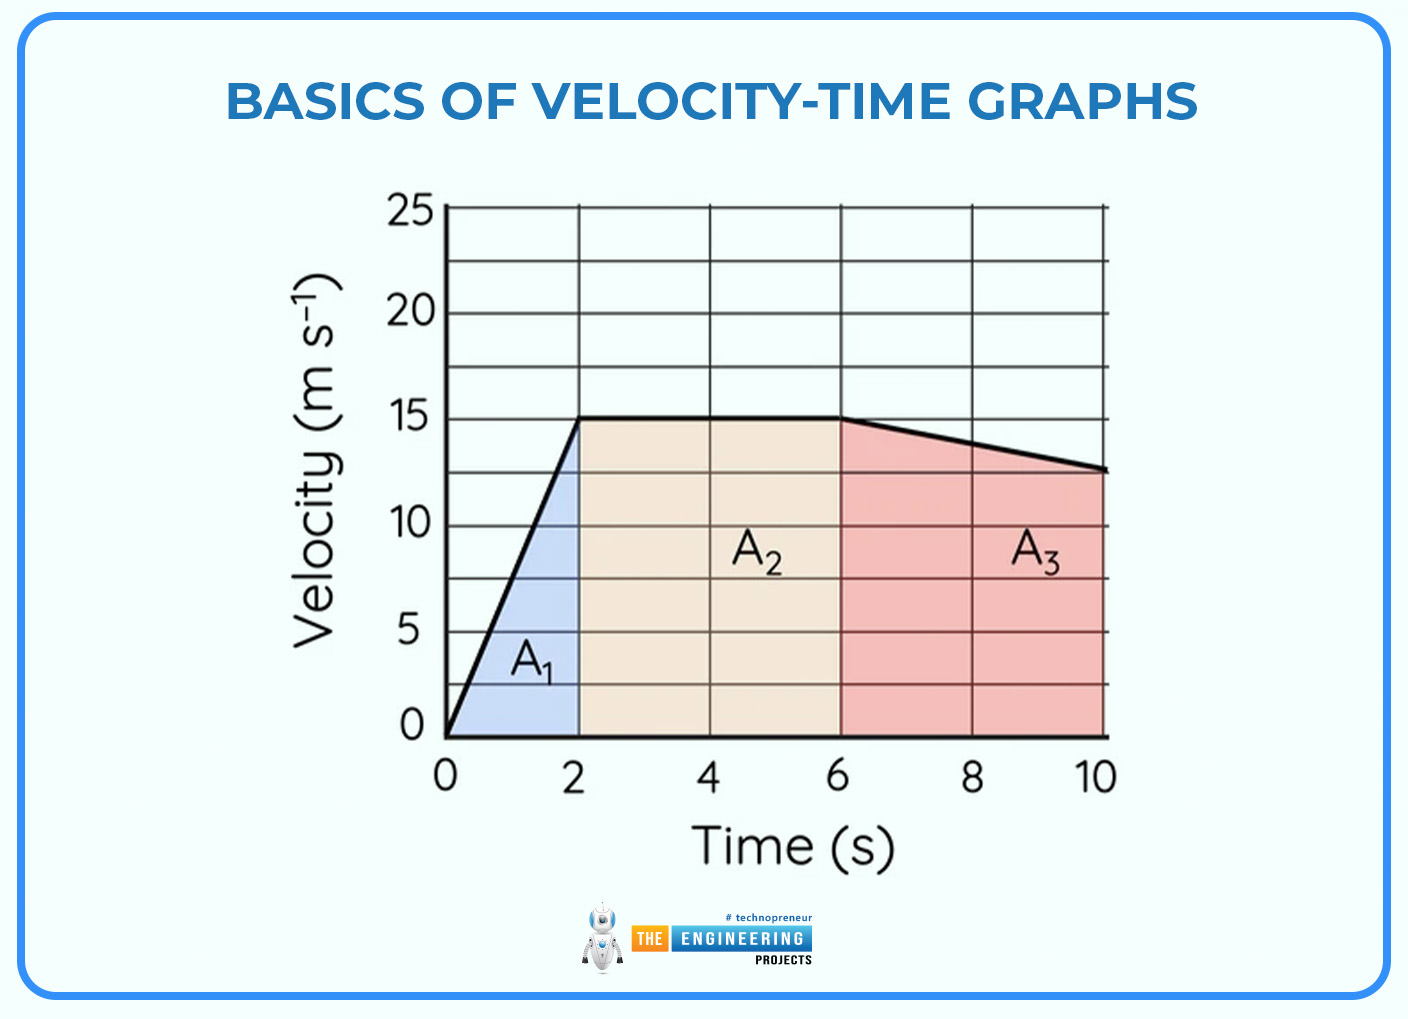
Velocity-time graphs serve as a key tool in physics showing how an object's velocity changes as time passes. These graphs offer a way to see and measure how things move. To get the hang of velocity-time graphs, you need to know their main parts and how they tell us about an object's movement.

AXES AND PLOTTING:
A velocity-time graph consists of two axes:
Horizontal Axis (Time):
This axis shows time measured in seconds (s). Time goes from left to right.
Vertical Axis (Velocity):
This axis displays velocity in metres per second (m/s) or kilometres per hour (km/h). Velocity has an impact on direction, with positive values indicating movement one way and negative values showing movement the opposite way.
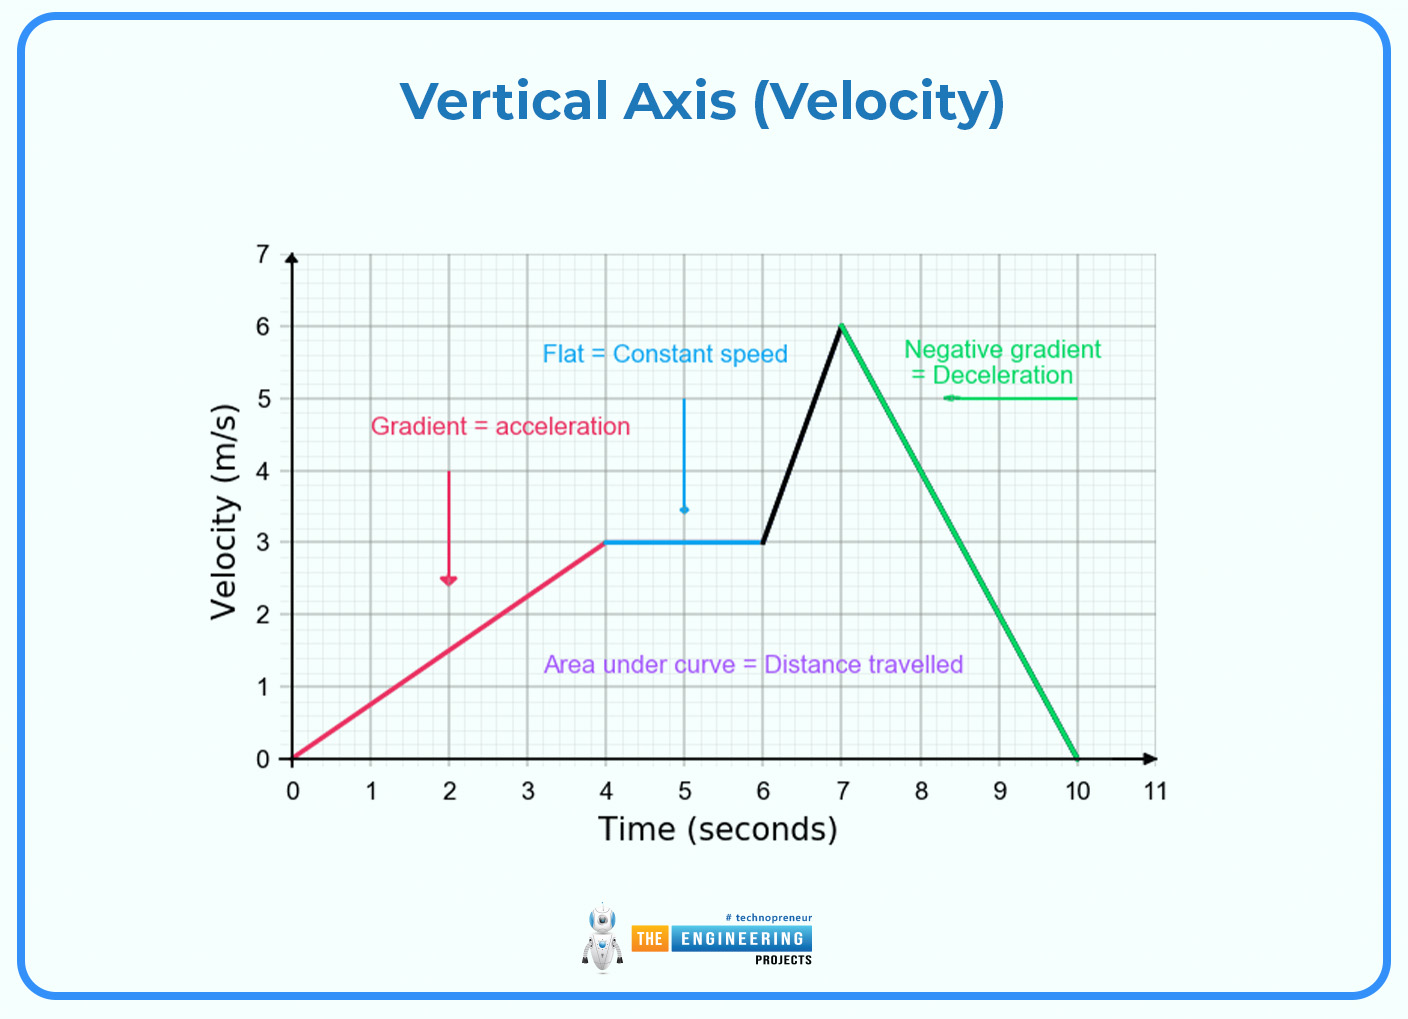
When you create a velocity-time graph, each point on the graph corresponds to the object's speed at a particular moment. These points are connected to form a line or curve that shows the movement of an object over time.
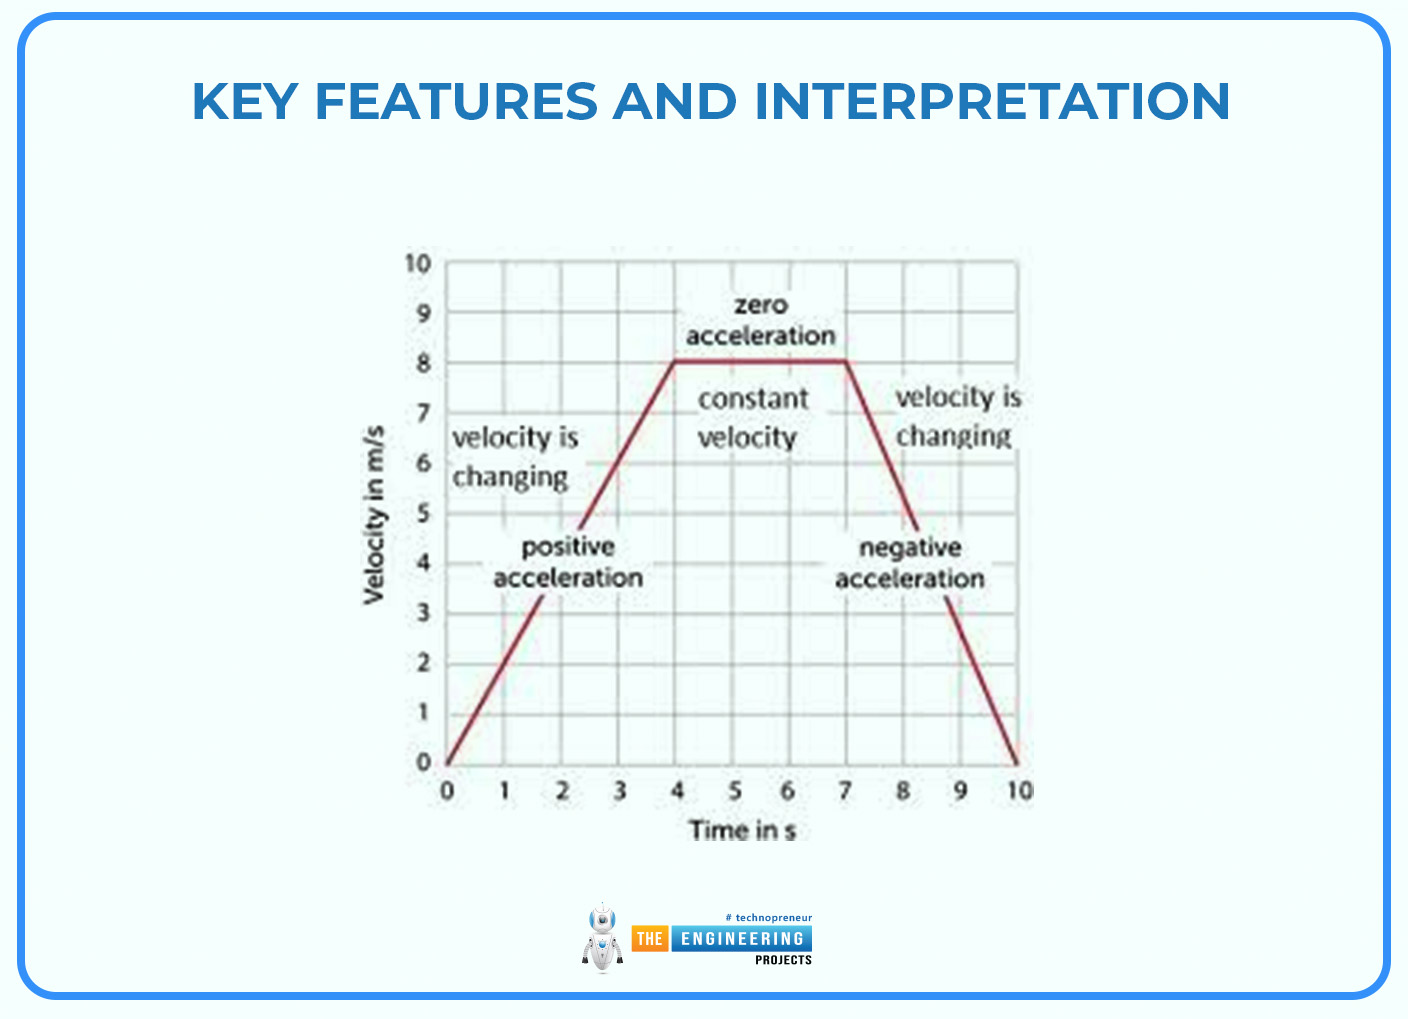
KEY FEATURES AND INTERPRETATION:
Constant Velocity:
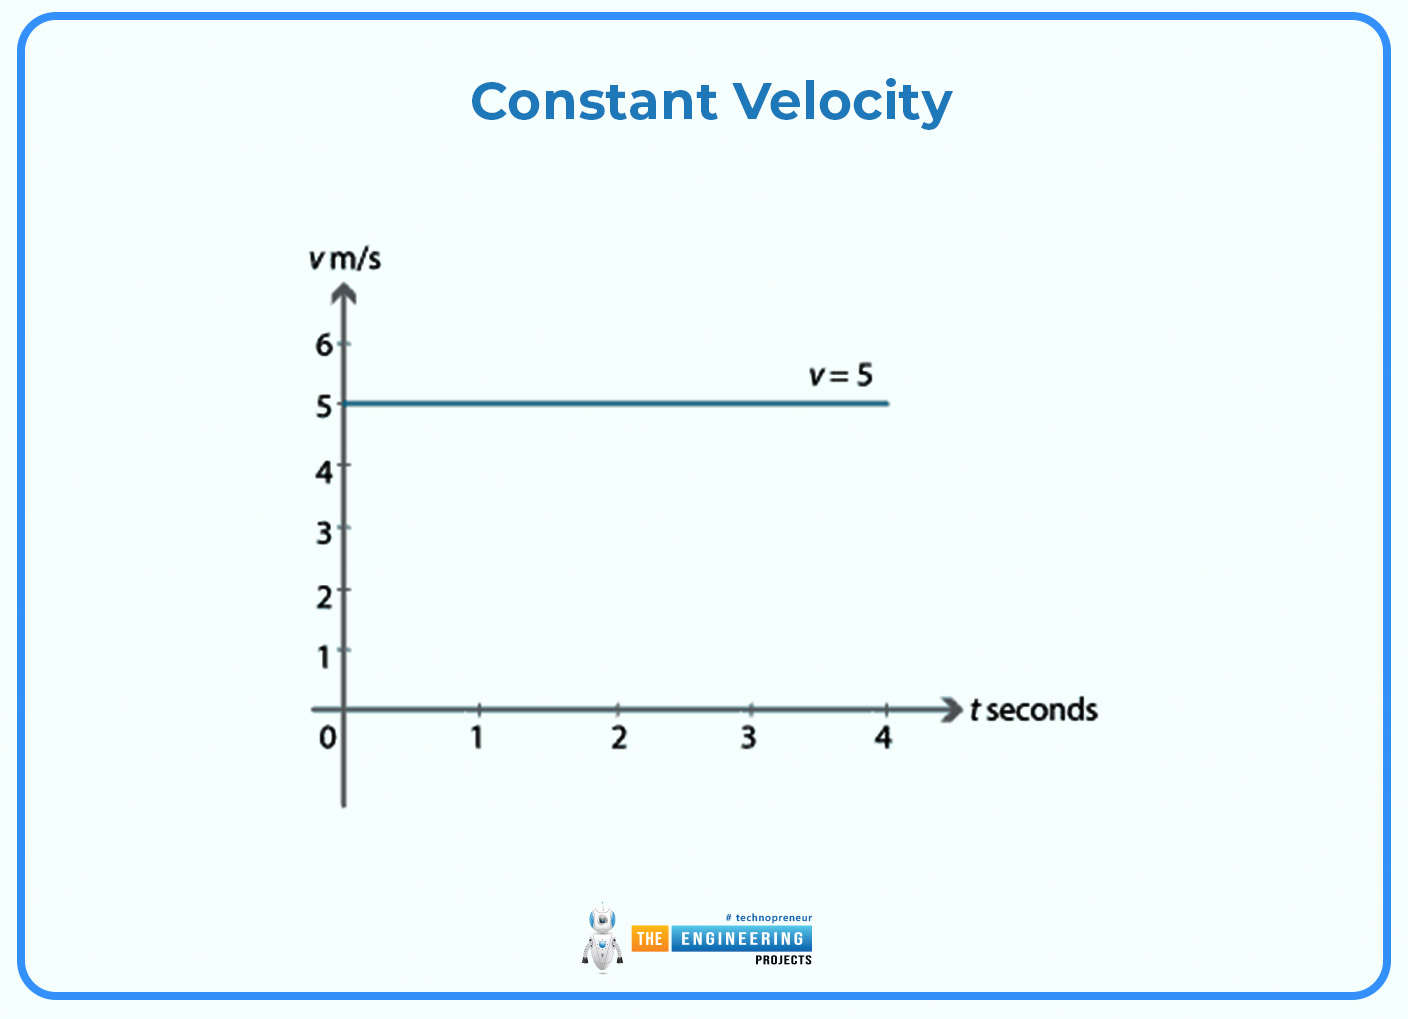
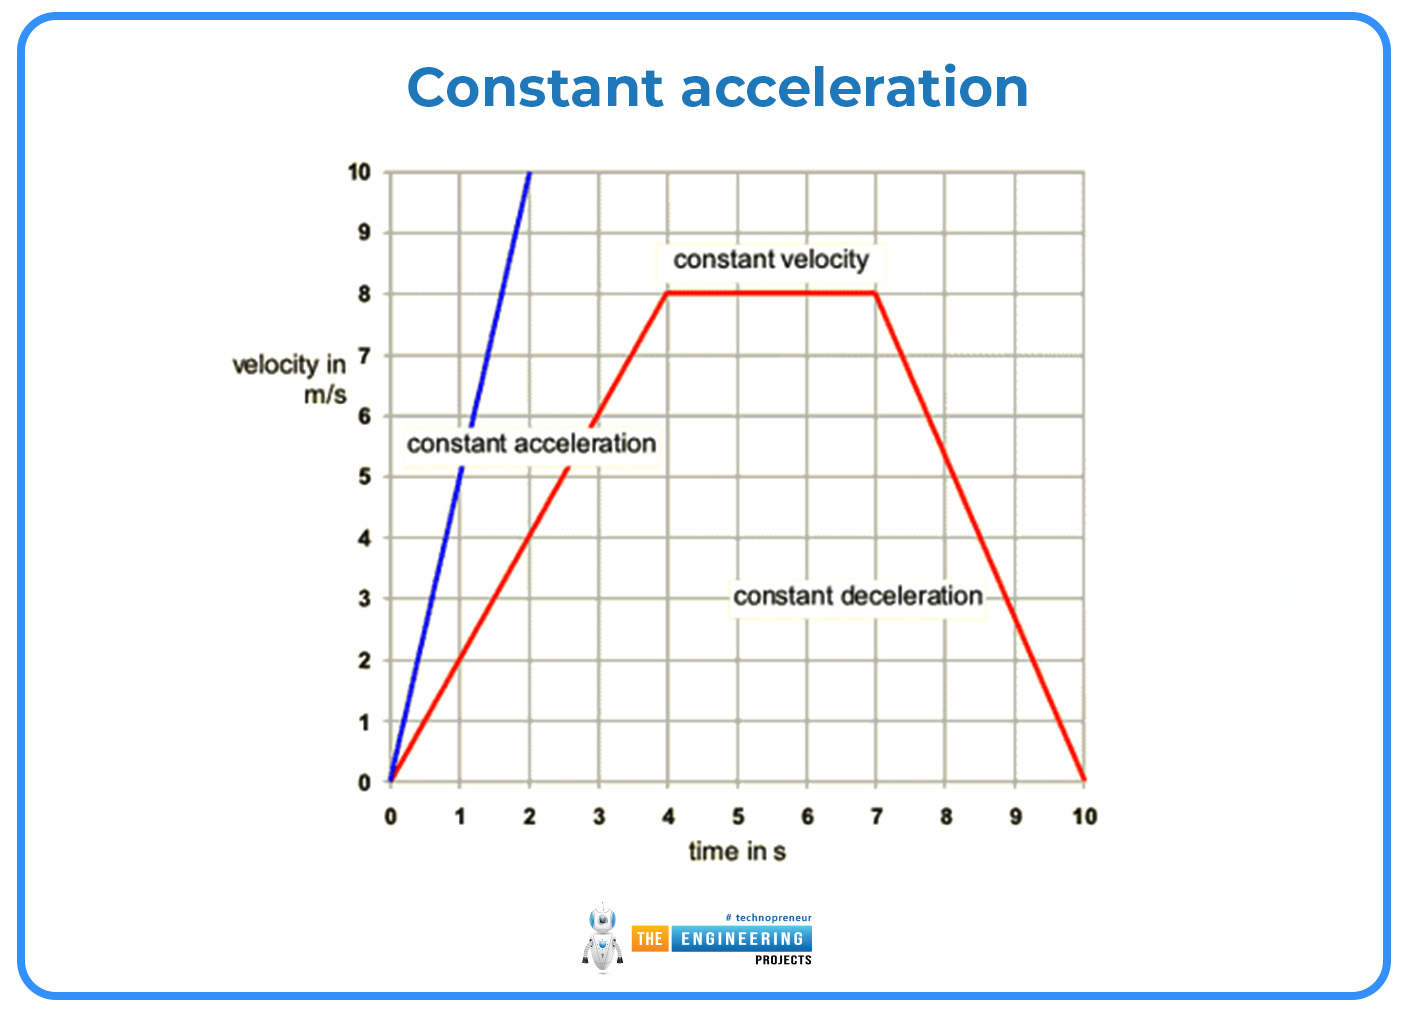
A horizontal line appears on the graph when an object moves at a steady speed and constant velocity. This line's height matches the unchanging velocity. Drive at 60 miles per hour. Its acceleration-time graph becomes straight at the 60 km/h mark. This means that the speed or acceleration of the vehicle remains constant over a long period ie. it does not move fast or slow.
Uniform Acceleration:
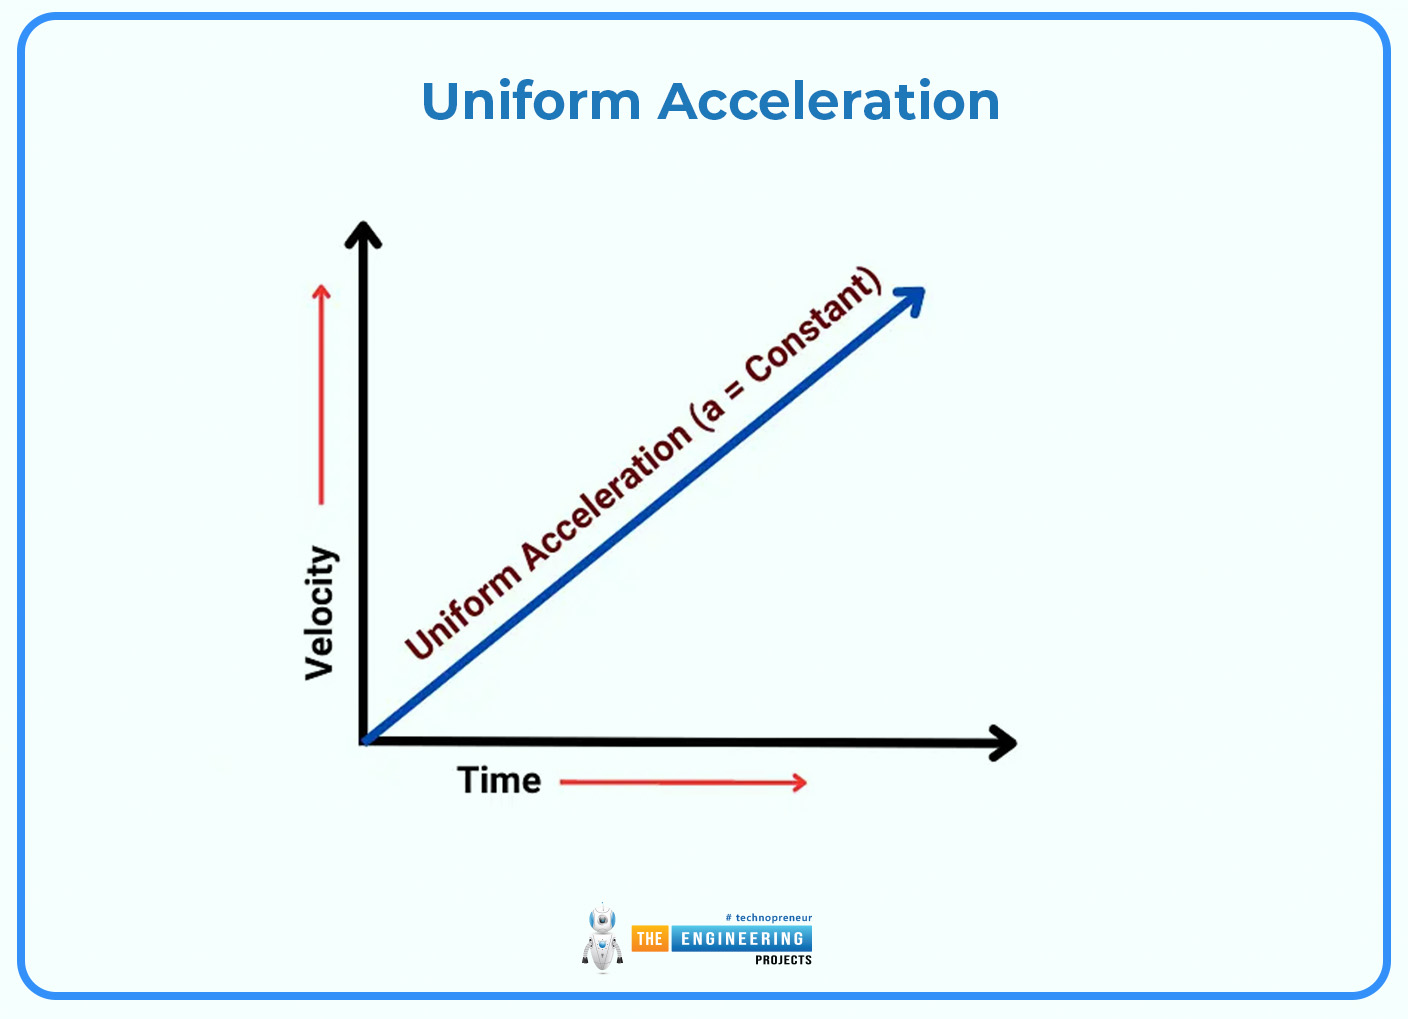
Watch a graph when an object speeds up or slows down. You'll see a straight line that's not flat. The steepness of this line shows how the object changes its speed. If the line goes up, it means the object is getting faster. If it goes down, the object is slowing down. For example, take a car that speeds up steadily from a standstill to 20 m/s in 5 seconds. The graph will display a straight line that slopes upward showing the car has an acceleration in the positive direction.
Non-Uniform Acceleration:
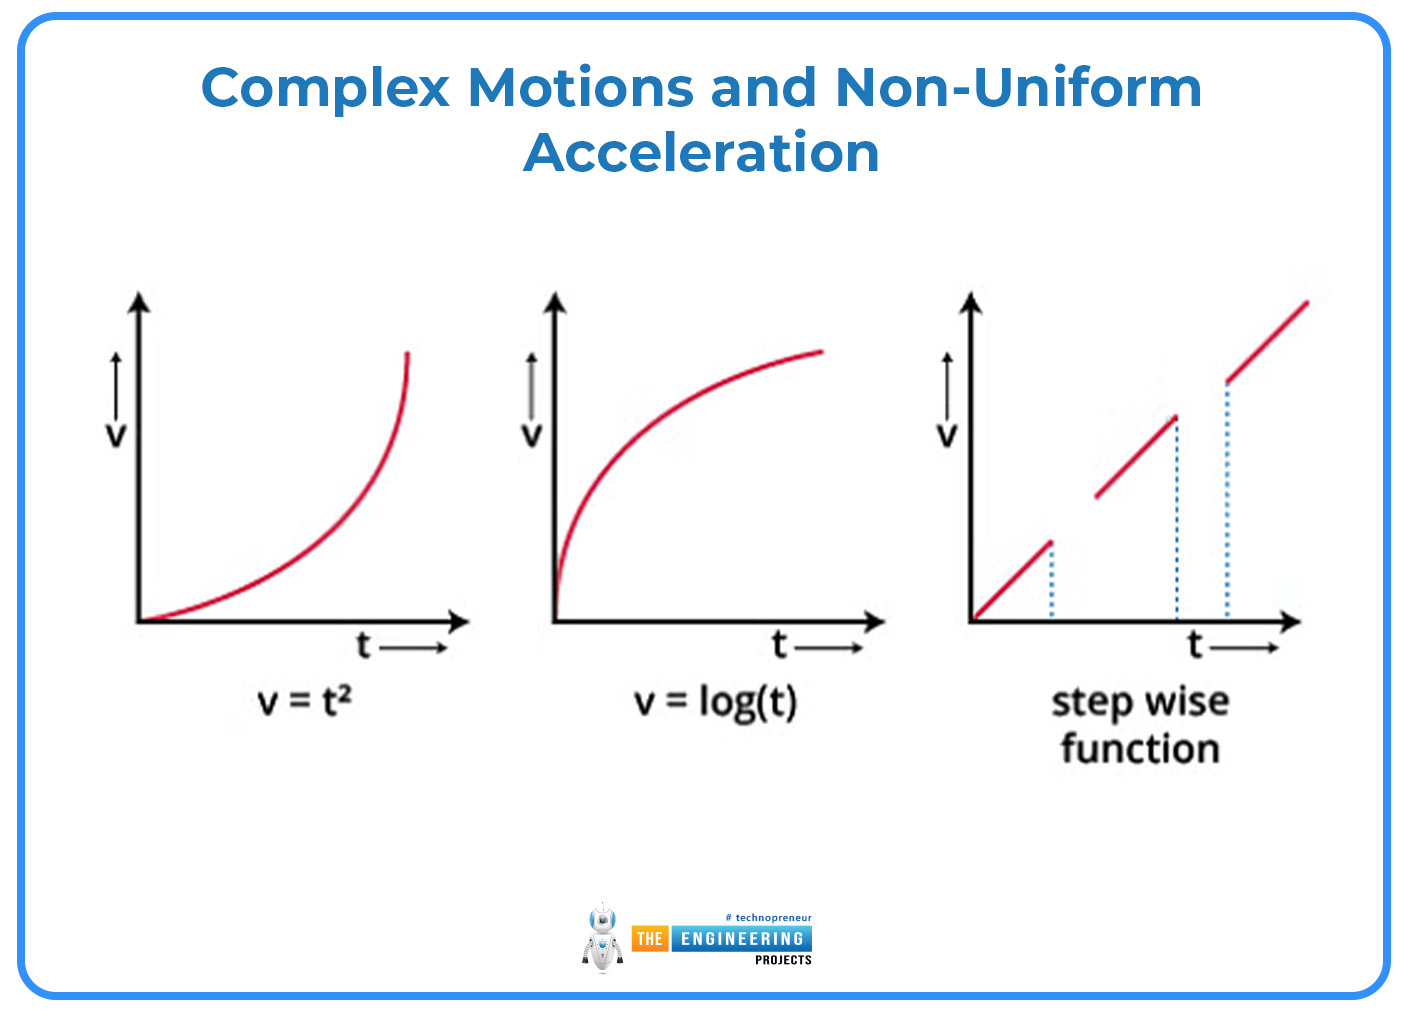
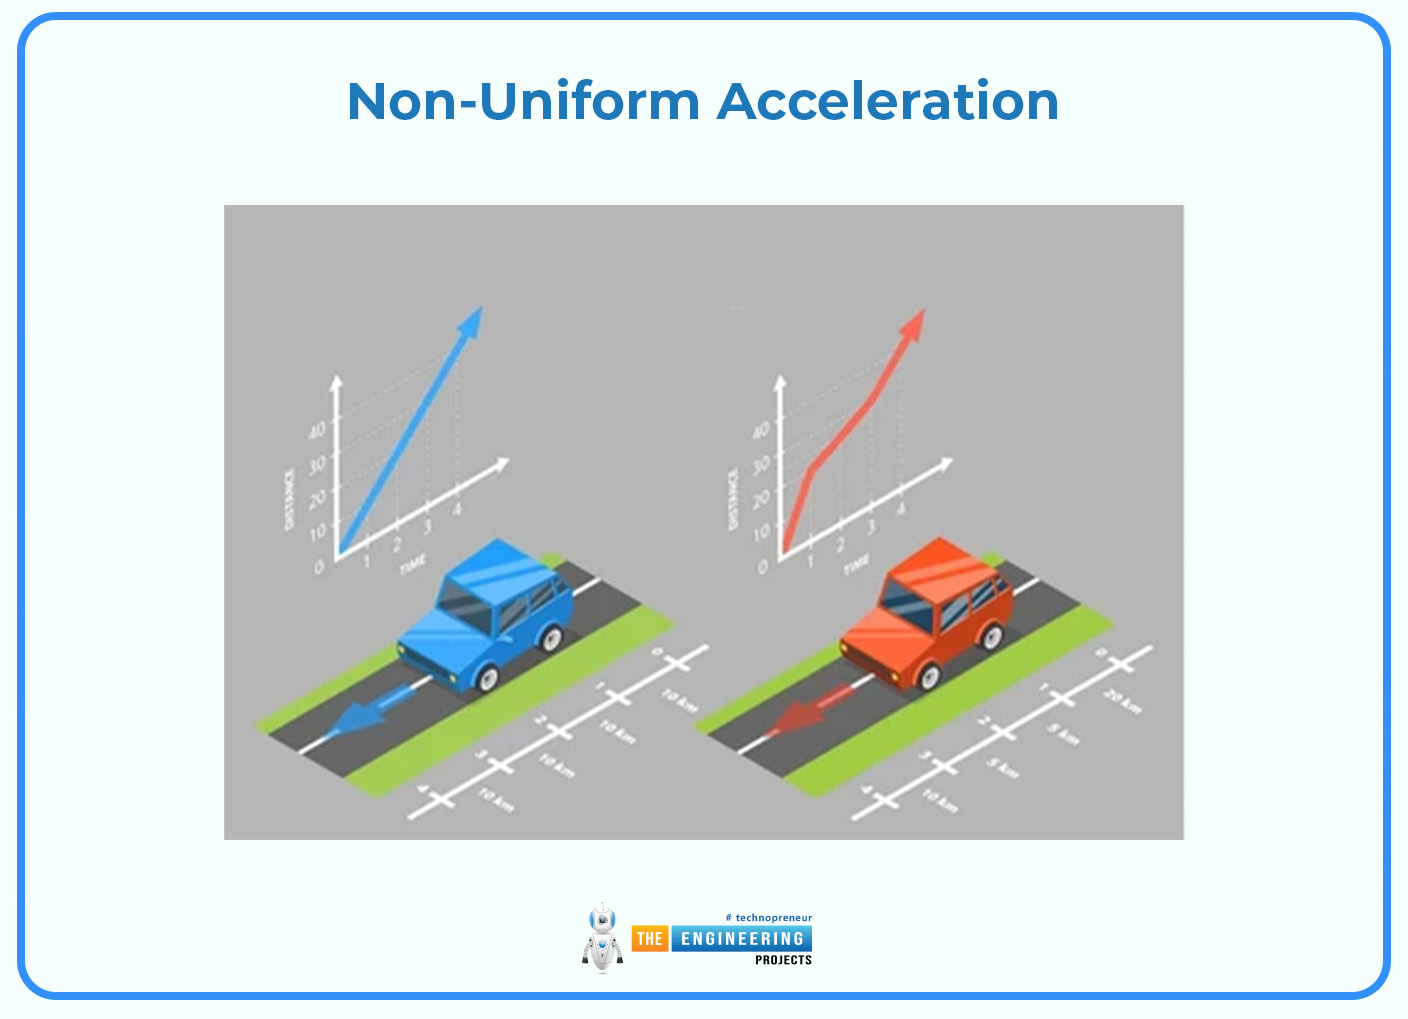
When acceleration isn't steady, the velocity-time graph shows a curve instead of a straight line. The curve's shape points to changing acceleration, with sharper bends showing bigger shifts in speed over shorter times. Take a car that speeds up faster as it goes: its velocity-time graph will have a curve that gets steeper as time passes.
Zero Velocity and Rest:
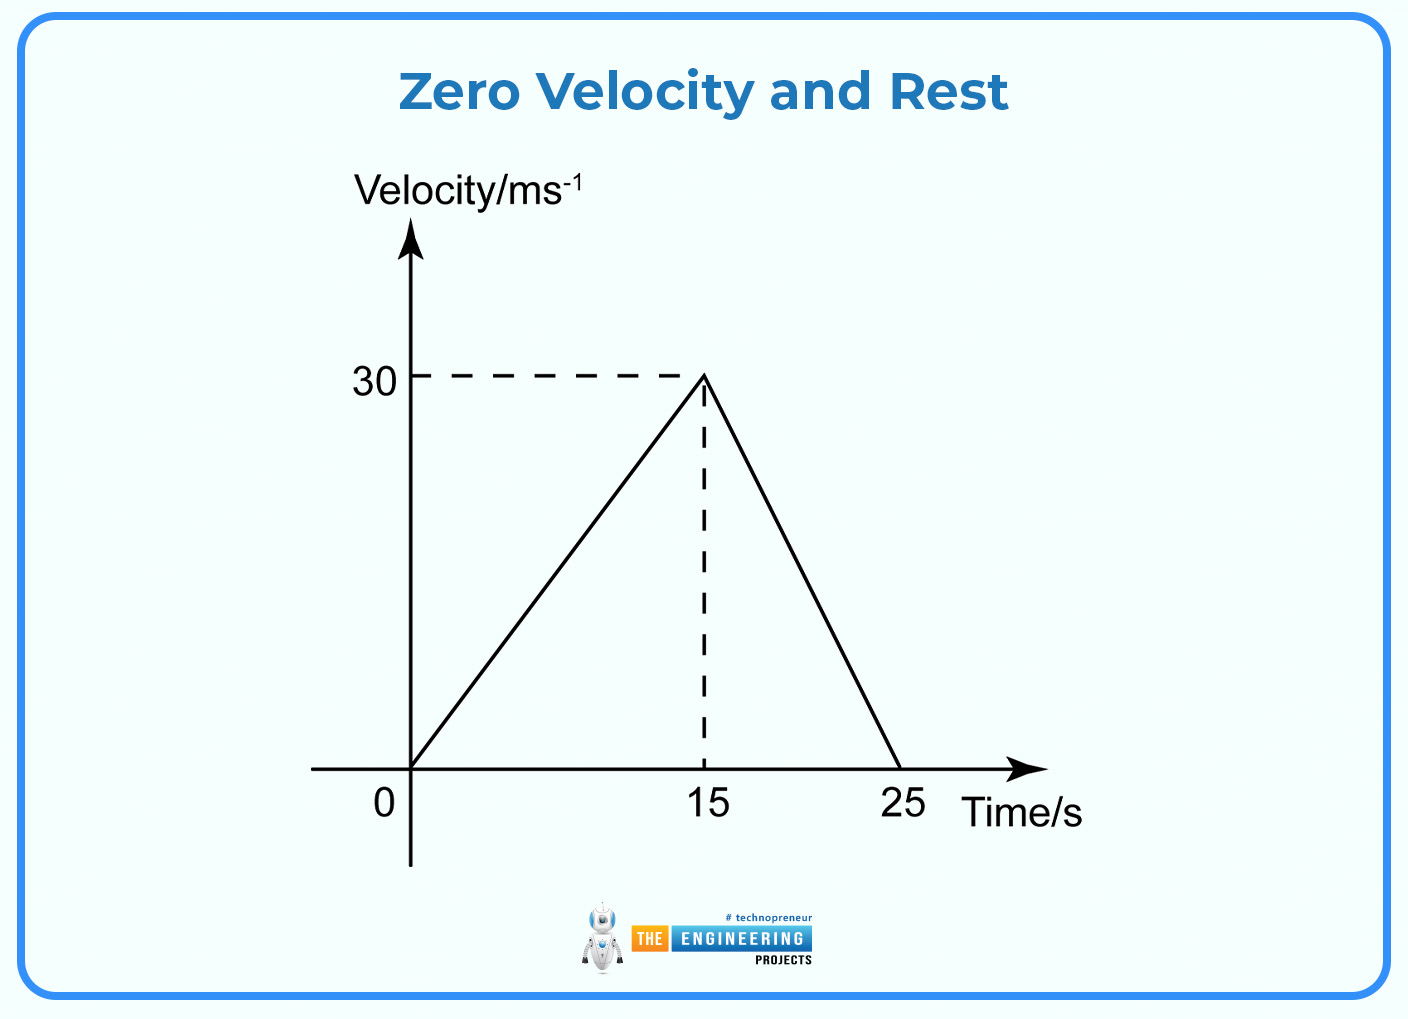
A spot where the graph meets the horizontal axis (velocity = 0) shows when the object stops moving. If the graph stays flat along the horizontal axis for a while, the object doesn't budge during that time.
Direction of Motion:
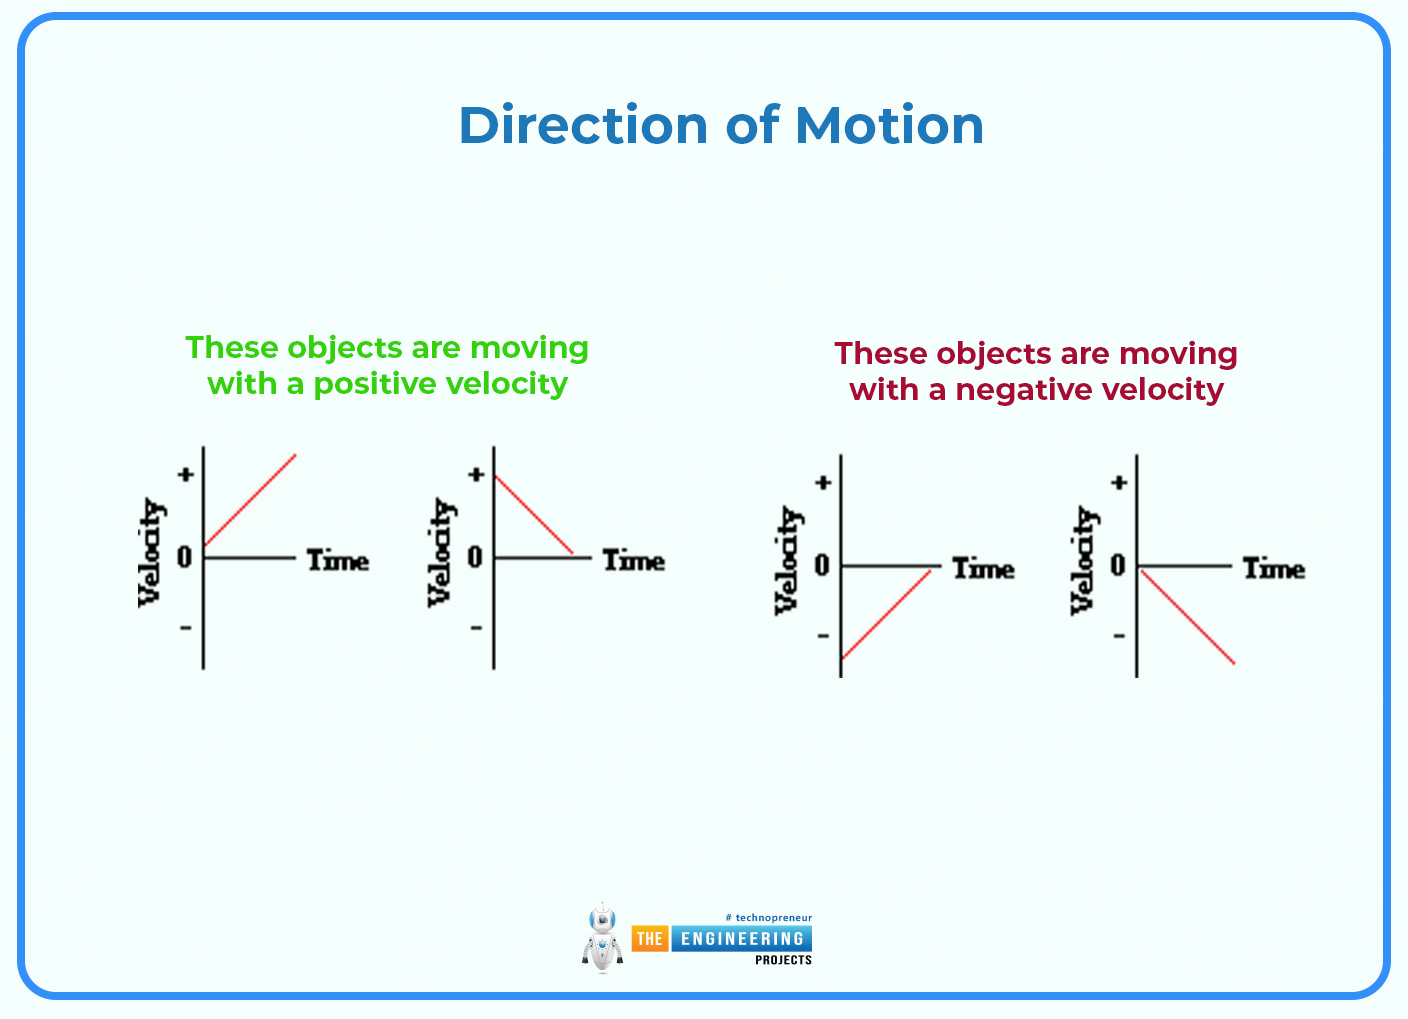
The plus or minus sign of the velocity shows which way something's moving. A plus sign means it's going in what we call the "positive" direction (like right or up), while a minus sign means it's going the other way.
Understanding these main points helps us to analyse how things move in detail. When we examine the graph's shape and the way steep it is, we can figure out if something's shifting at an equal speed, speeding up, or slowing down. We can also work out critical numbers like how quickly it is speeding up and how far it is long gone. This sort of analysis is fundamental to solving real troubles in physics and engineering. When we apprehend how things flow, we can lay out more secure and greater or efficient systems.
MATHEMATICAL EQUATIONS AND CALCULATIONS:
Velocity-time graphs do more than just show motion. They also give us numbers about how things move. When you look at these graphs, you can figure out important stuff like how fast something speeds up and how far it goes. These details are key to getting how objects behave when they move. This part digs into the maths side of velocity-time graphs. It explains how to find and work out these crucial numbers.
Calculating Acceleration:
The speed of change in velocity over time is what we call acceleration. To figure out acceleration on a velocity-time graph, you need to work out the steepness of the line.
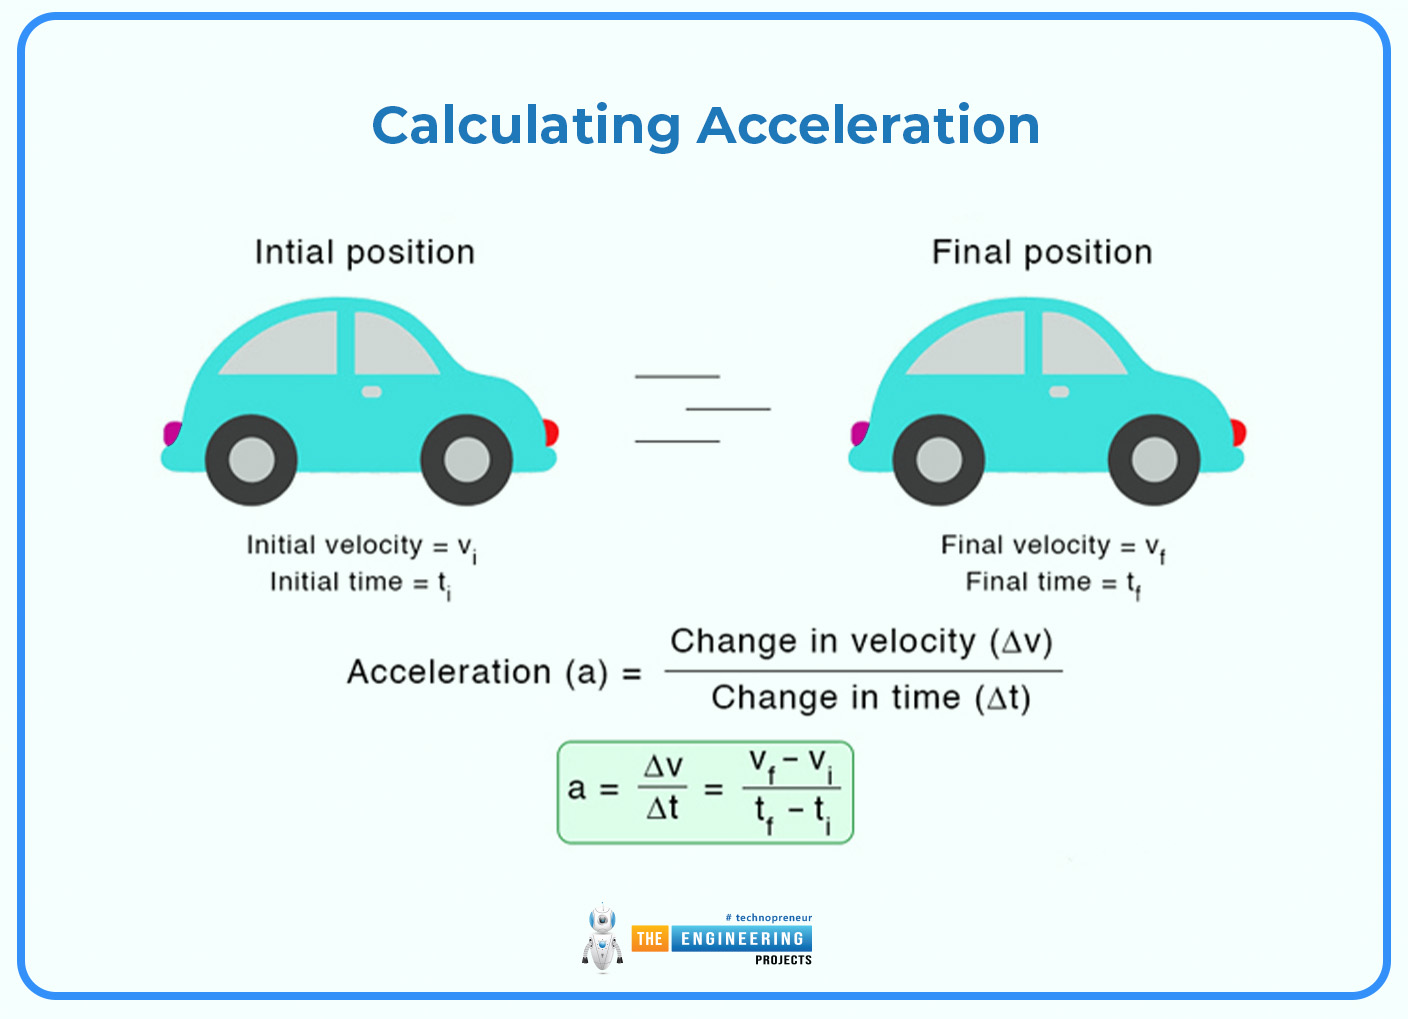
Formula for Acceleration:
a = v/ t
Where:
a is the acceleration,
v (delta-v) shows the change in velocity,
t (delta t) shows the change in time.
To discover the acceleration, become aware of two factors on the graph and use their coordinates (v1, t1 ) and (v2, t2 ) to calculate the velocity change ( v2 - v1 ) and the corresponding change in time (t2 - t1). The slope of the line, as by the ratio v / t , gives the acceleration.
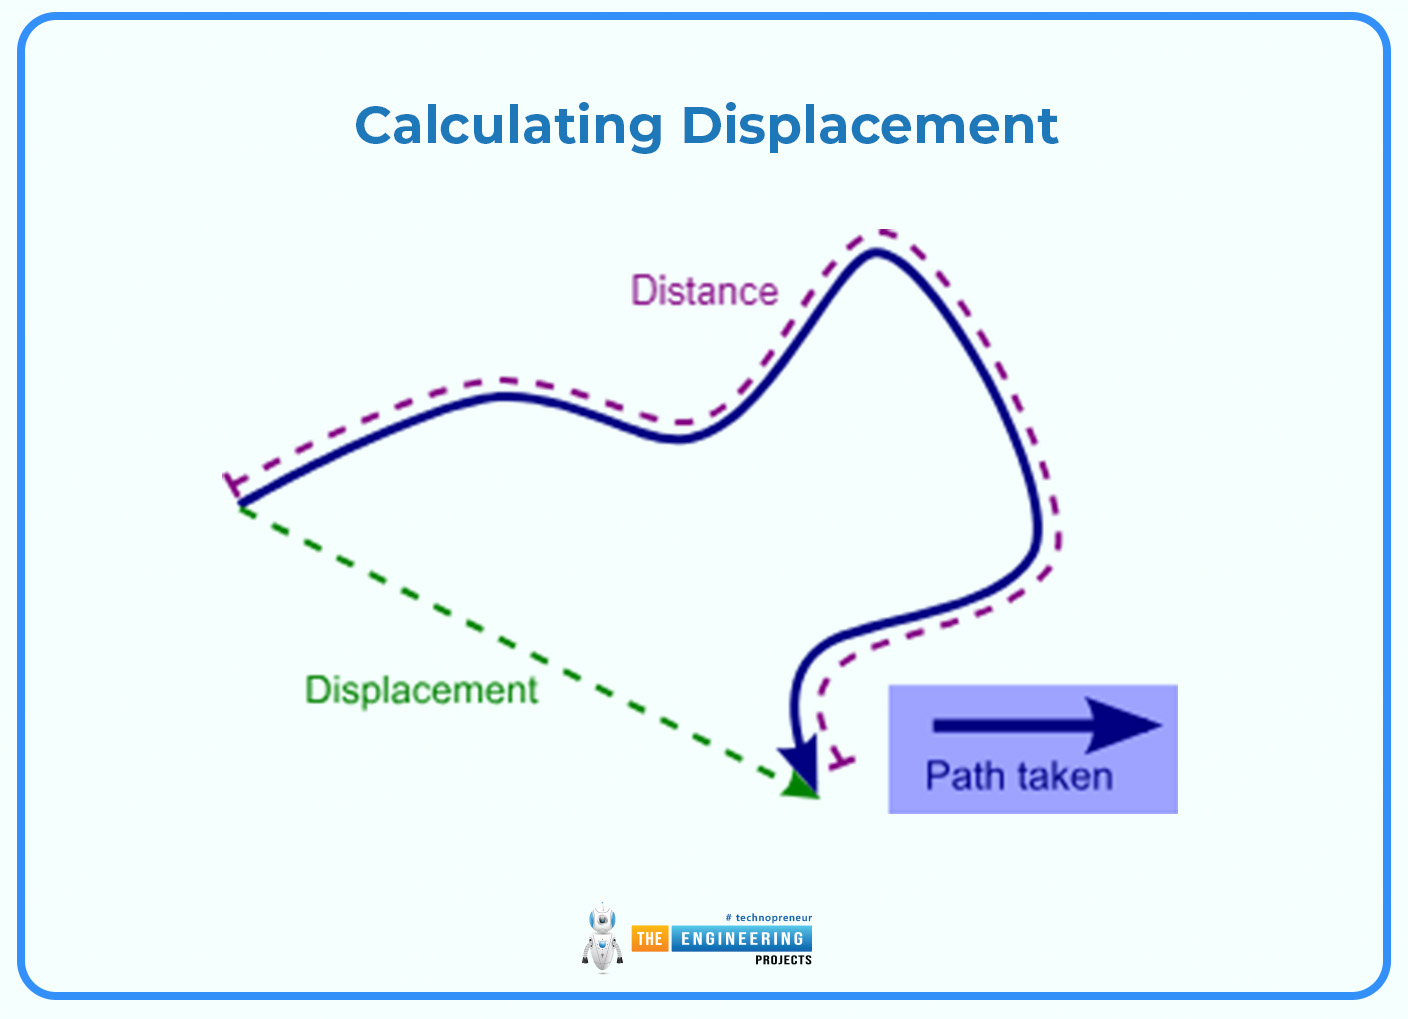
Calculating Displacement:
Displacement, the overall change in position, can be found using the area under the velocity-time graph. This area corresponds to the integral of velocity over time, which gives the total displacement.
For Constant Velocity:
If the graph shows a horizontal line (constant velocity), the displacement (s) is simply the product of velocity (v) and time (t):
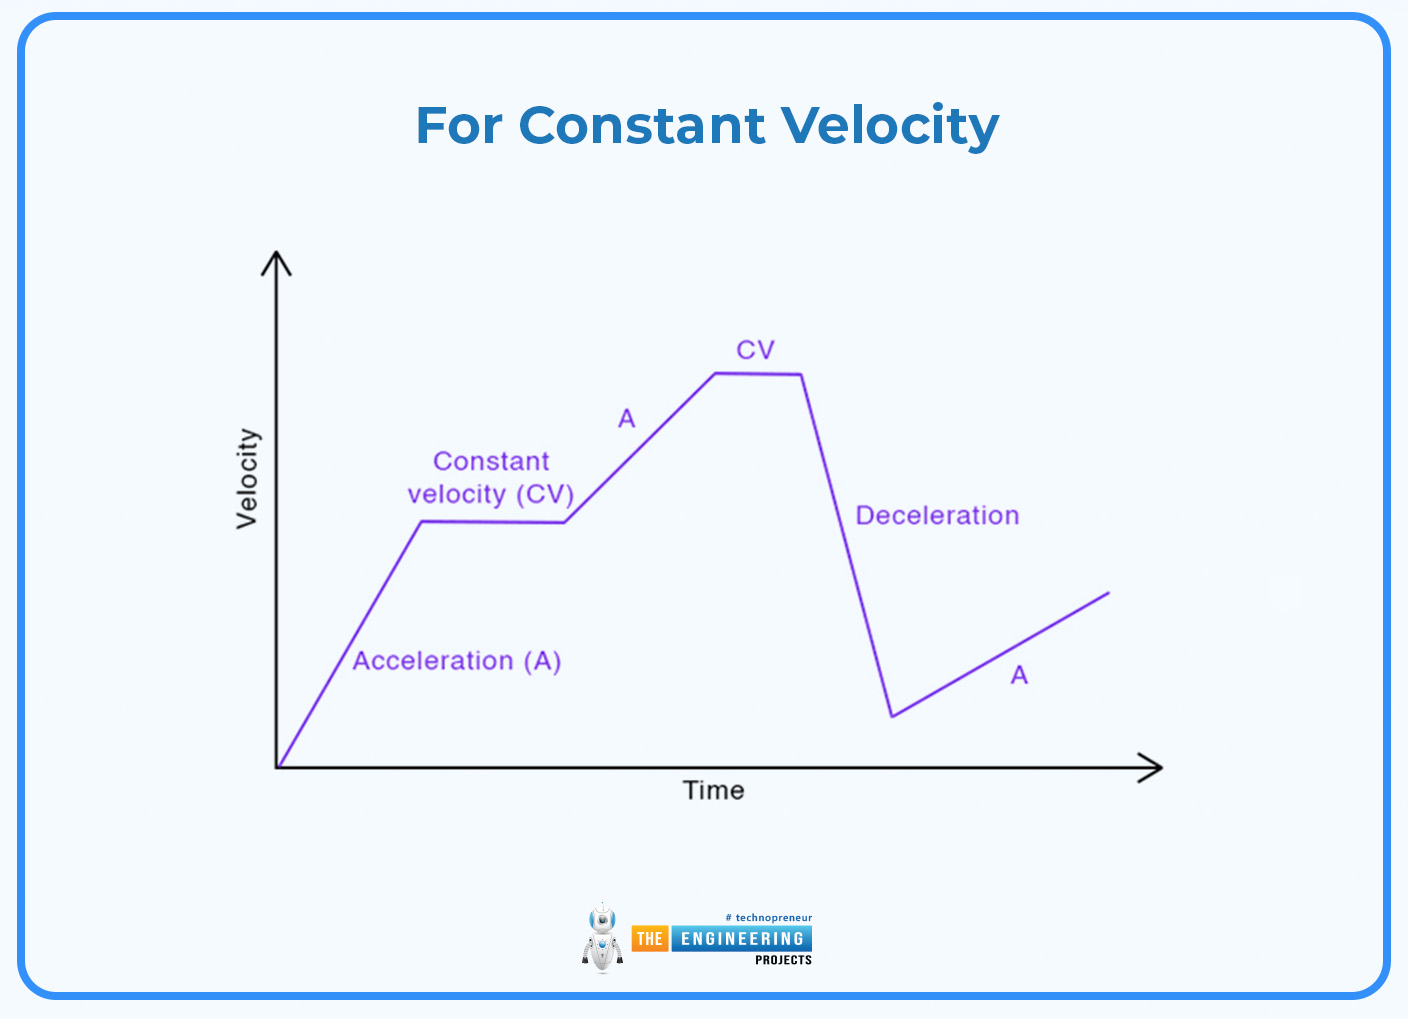
s = vt
For Varying Velocity (Uniform Acceleration):
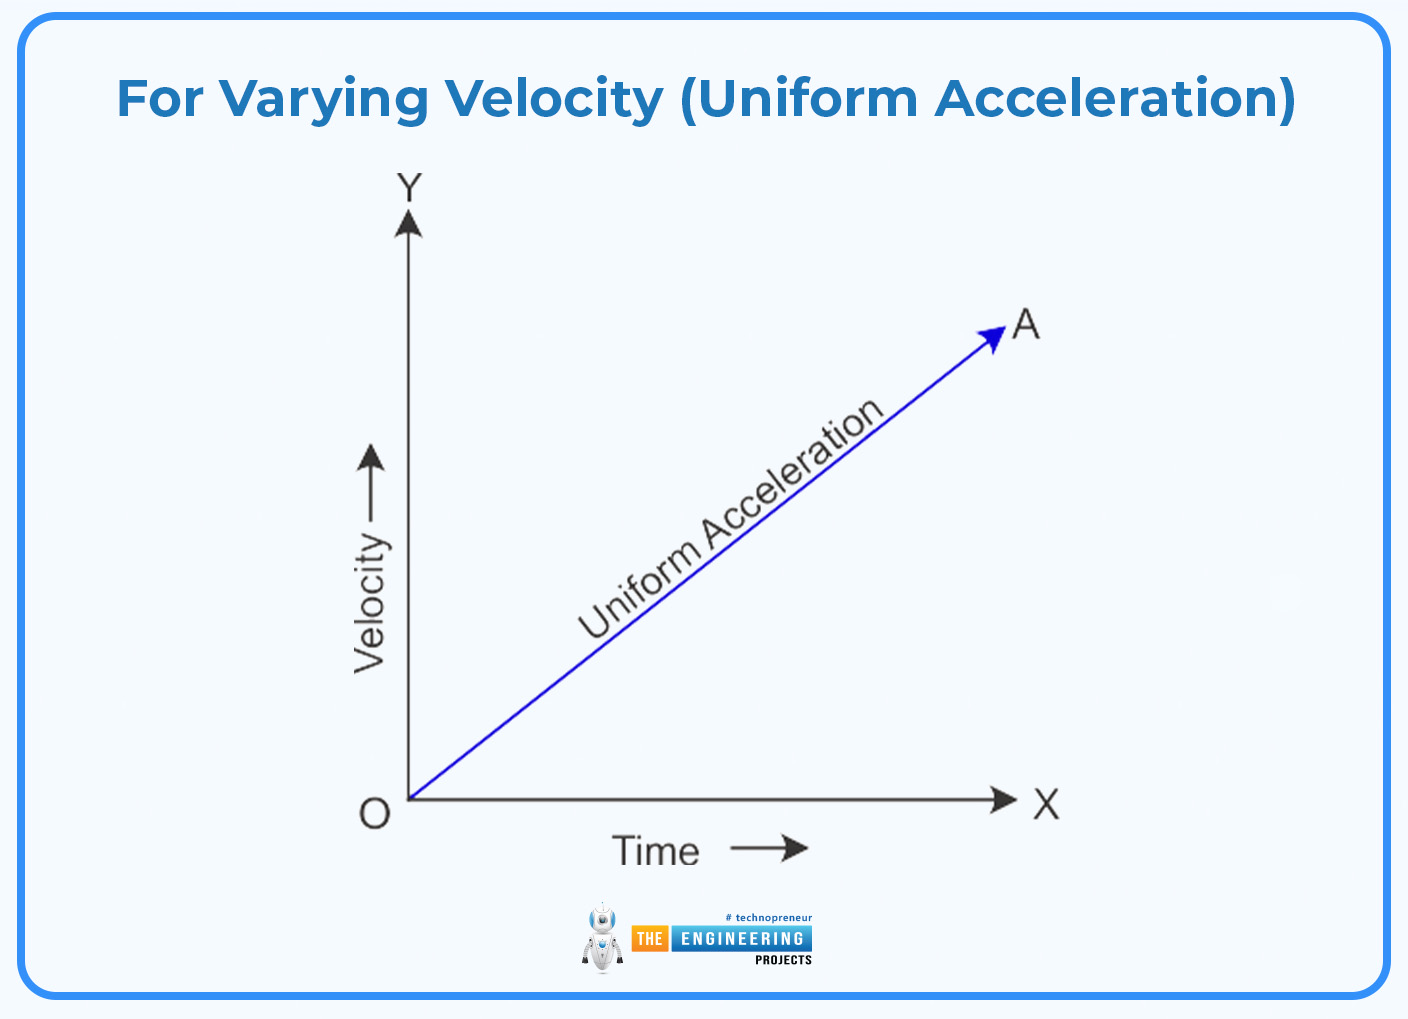
When velocity changes uniformly, the area under the line can be calculated using geometric shapes. A common scenario involves a triangle or a trapezoid under the graph line.
Triangle Area (for acceleration from rest):
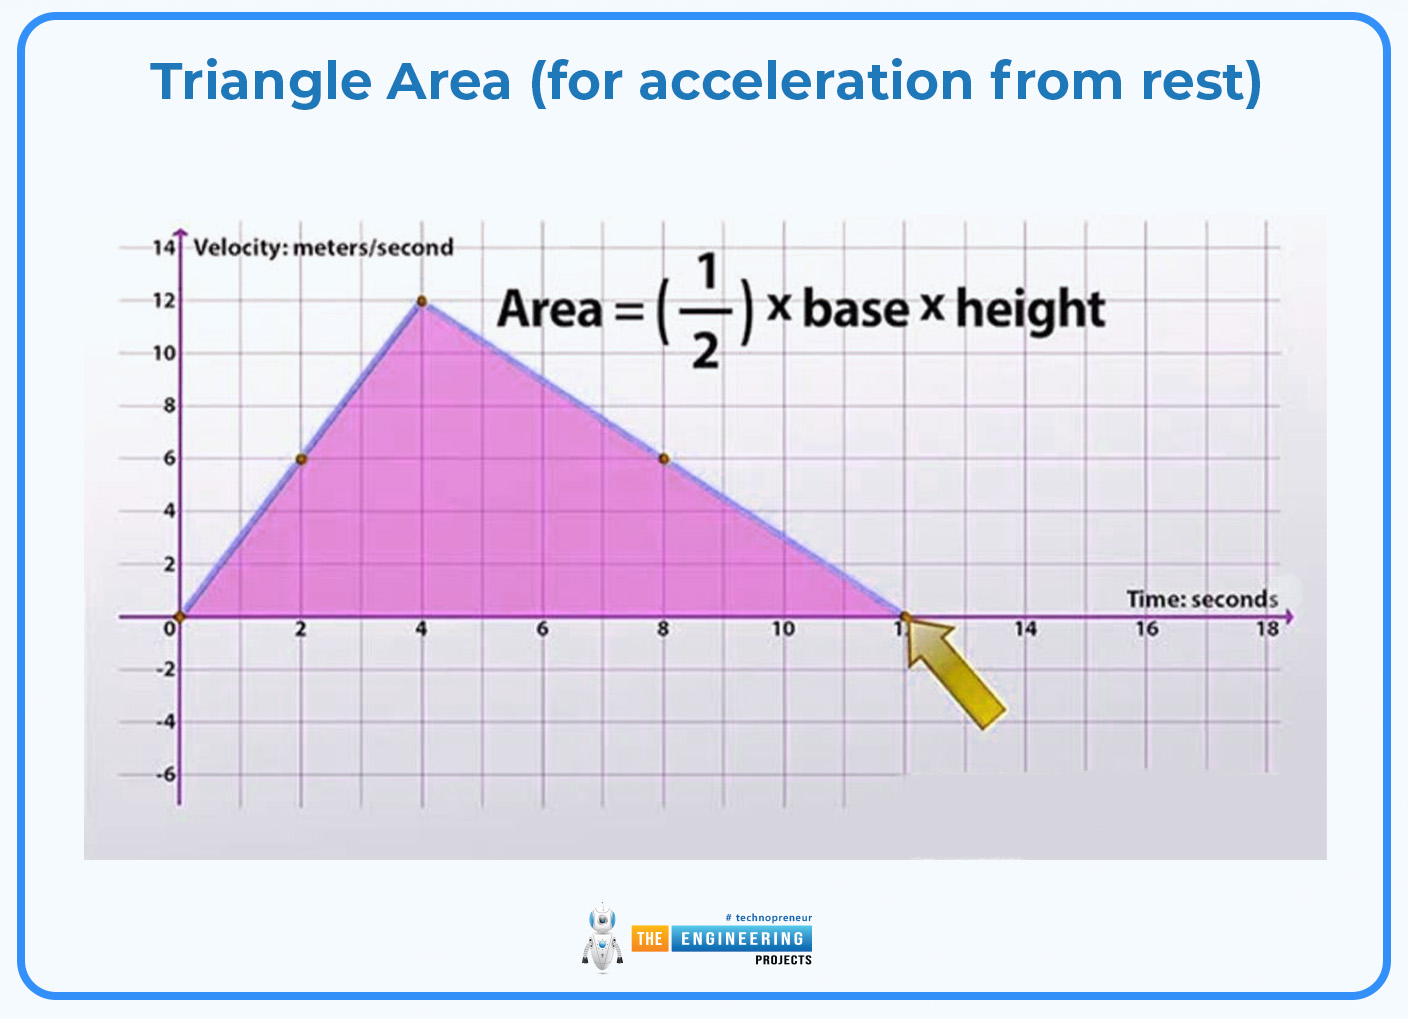
area = 1/2 base height
Where the base represents time (t) and the height represents the change in velocity (Delta v). The area gives the displacement.
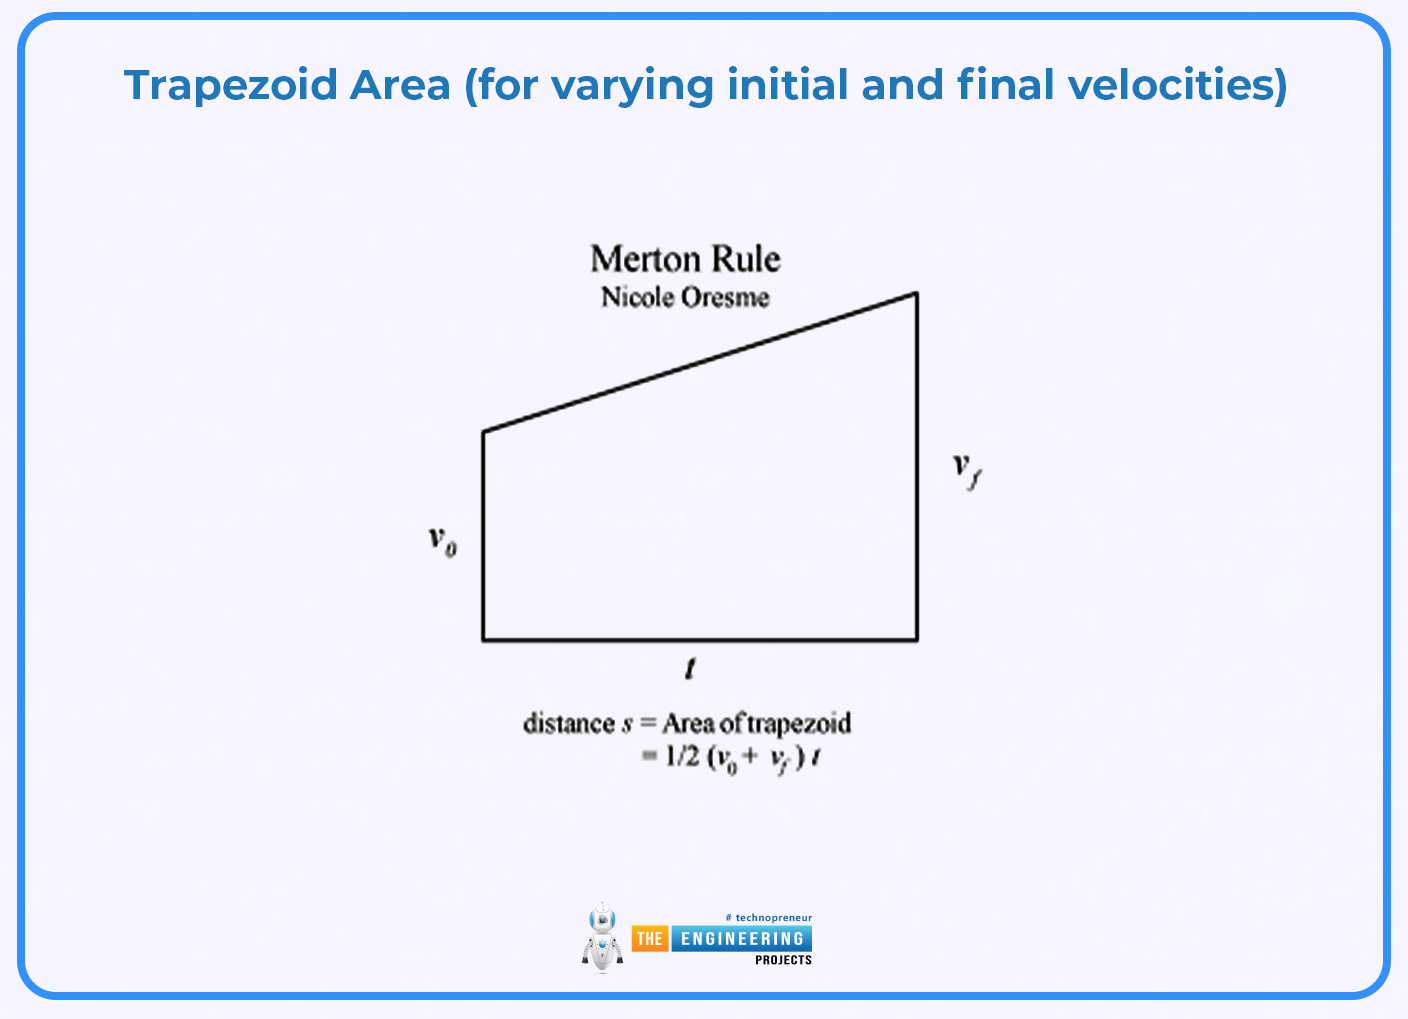
Trapezoid Area (for varying initial and final velocities):
When the object starts with a non-zero velocity, the area under the graph forms a trapezoid. The displacement is given by:
s = 1/2 (Vinitial + Vfinal)t
Example:
A motor car with an initial velocity of 10 m/s accelerating to 30 m/s over 5 seconds:
s = 1/2 (10 +30)m/s5s
s= 1/2405 = 100m
Additional Considerations:
Negative Areas and Displacement:
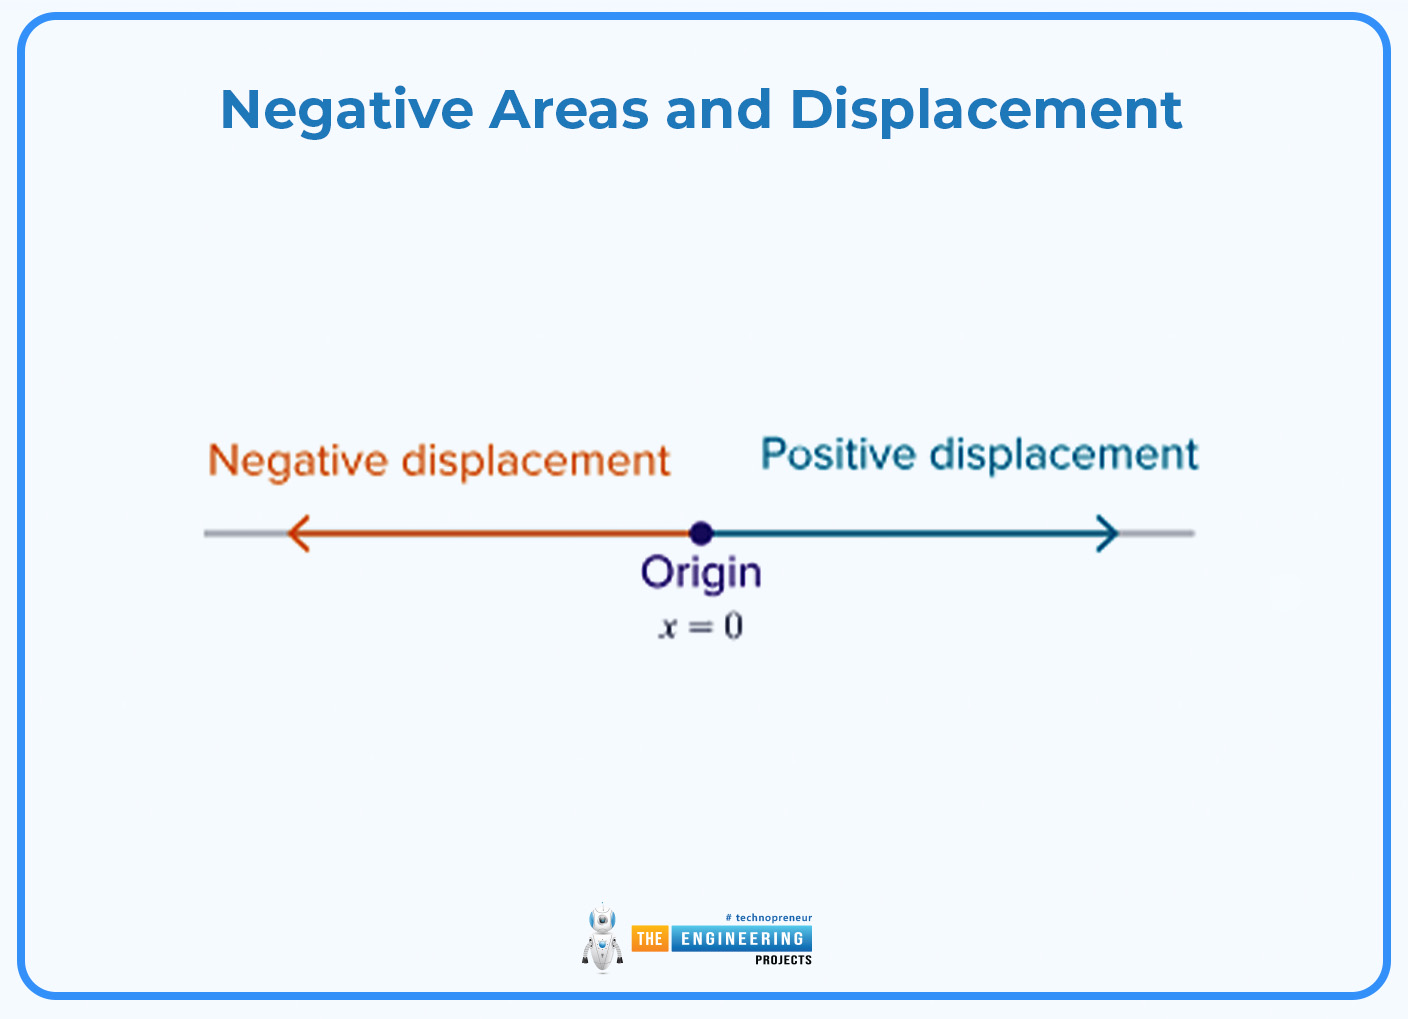
When the velocity-time graph falls below the horizontal axis, the area calculated is considered negative, indicating displacement in the opposite direction.
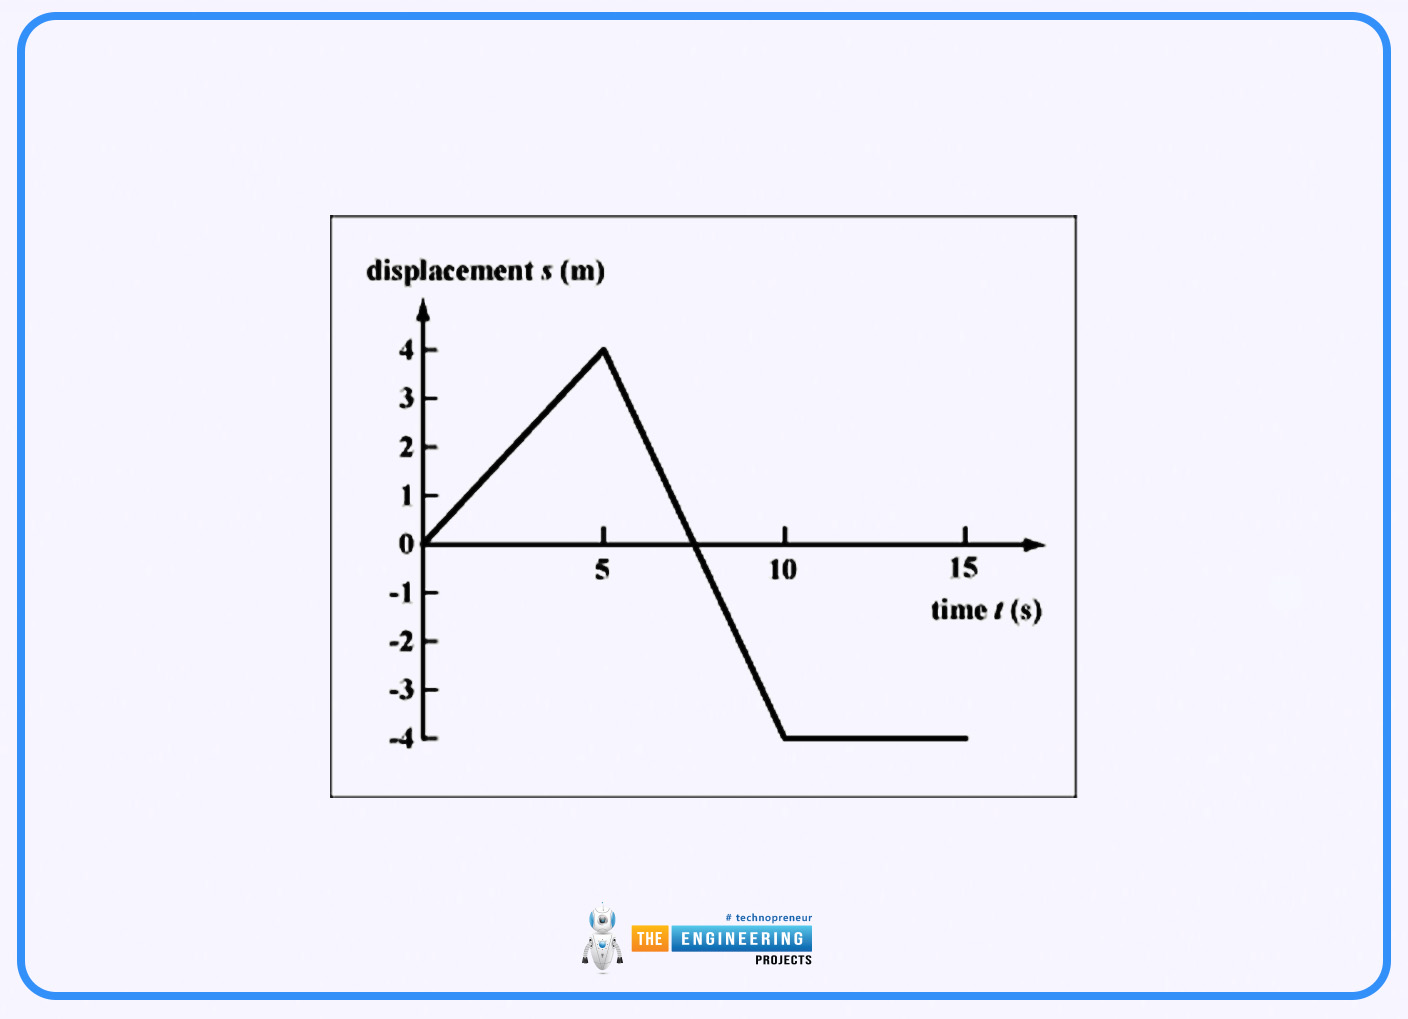
Complex Graphs:
For graphs with varying acceleration, the area can be segmented into simpler geometric shapes (rectangles, triangles, trapezoids) or calculated using calculus for more complex curves.
For professionals and students who need to analyse real-world motion scenarios, such as the design of car braking systems or the research of projectile motion in engineering and physics, an understanding of these computations is essential. These ideas serve as the cornerstone for solving issues in applied and academic physics settings.
EQUATION OF MOTION:
Average velocity:
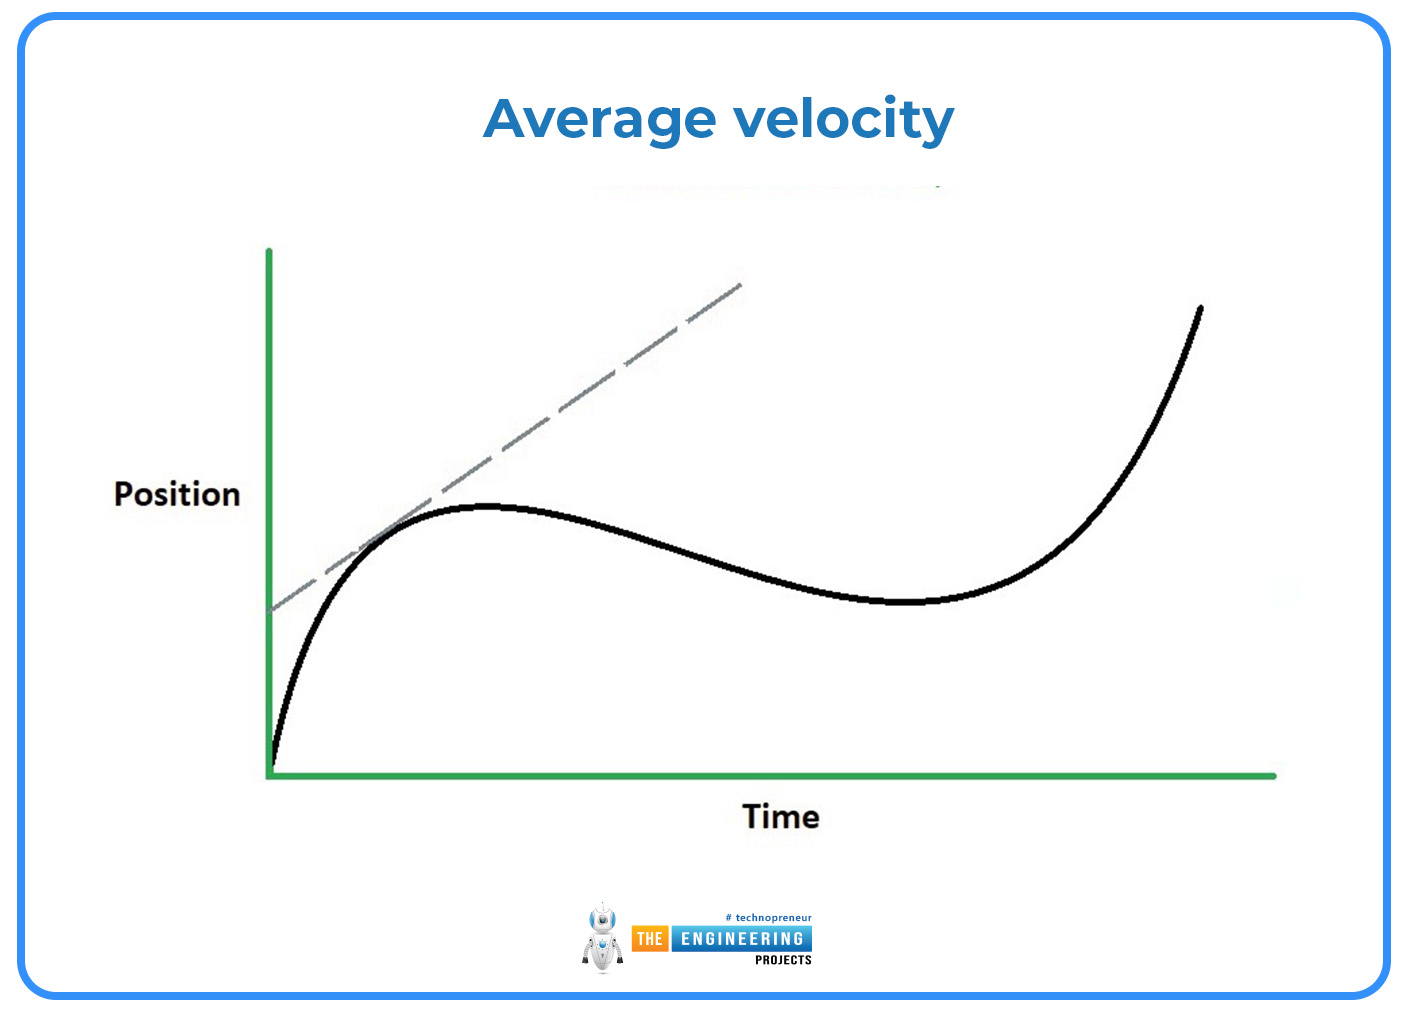
The definition of velocity is the rate at which a position changes with time. To distinguish from average velocity, this concept can also be known as instantaneous velocity. The average velocity of an object, or the constant velocity that would produce the identical resultant displacement as a variable velocity in the identical time interval, v(t), over some time Δt, may be required in various applications. One way to compute average velocity is:
v= x/t=t0t1 v(t)dtt1-t0
An object's average speed is always lesser or similar to its average velocity. This is demonstrated by observing that, in contrast to distance, which is always strictly rising, displacement can alter in magnitude and direction.
The instantaneous velocity can be defined as the slope of the tangent line to the arc at any spot on a displacement-time (x vs. t) graph, and the average velocity can be defined as the slope of the second line between two points whose t coordinates equal the boundaries of the average velocity's period.
Special cases
When a particle moves with different uniform speeds v1, v2, v3, ..., vn in different time intervals t1, t2, t3, ..., tn respectively, then the average speed over the total time of journey is given as;
𝑣¯= 𝑣1𝑡1 + 𝑣2𝑡2 +𝑣3𝑡3+⋯+ 𝑣𝑛𝑡𝑛 / t1 + t2 + t3 + ……..+ tn
If t1 = t2 = t3 = ... = t, then the average speed is given by the arithmetic mean of the speeds
v = v1 + v2 +v3 +........+ vnn = 1n i=1nvi
When a particle moves different distances s1, s2, s3,..., sn with speeds v1, v2, v3,..., vn respectively, then the average speed of the particle over the total distance is given as
v = s1 + s2 + s3 +. . . . . . . . + snt1 + t2 + t3 +. . . . . . . . . .+ tn =s1 + s2 + s3 +. . . . . . . .+ sns1v1 + s2v2 + s3v3 + . . . . . . . . . snvn
If s1 = s2 = s3 = …….. = s, then the average speed is given by the harmonic mean of the speeds
𝑣¯=𝑛 (1v1+ 1v2+1v3+. . . . . . +1vn)-1
v = n (i=1n1vi )-1
Relationship to acceleration:
While velocity is defined as the rate of change in position, it is typical to begin by expressing an object's acceleration. Based on the three green tangent lines in the figure, The slope of the line tangent to the curve of a v(t) graph at a given point determines the instantaneous acceleration of an object. In other words, instantaneous acceleration is defined as the derivative of velocity concerning time:
a = dv/ dt
An expression for velocity can be obtained by examining the area under an a(t) acceleration vs. time graph from there. As previously stated, this can be achieved by utilising the concept of the integral:
𝑣= ∫ 𝑎 𝑑𝑡.
Constant acceleration
In the special case of constant acceleration, velocity can be studied using the equations. By considering an as being equal to some arbitrary constant vector, it is trivial to show that
𝑣 = 𝑢 + 𝑎𝑡
with v as the velocity at time t and u as the velocity at time t = 0. By combining this equation with the equation x = ut + at2/2, it is possible to relate the displacement and the average velocity by
x = (u + v)2 t = vt.
It is also possible to derive an expression for the velocity independent of time, known as the Torricelli equation, as follows:
𝑣2 = 𝑣⋅𝑣 = (𝑢+𝑎𝑡) ⋅ (𝑢+𝑎𝑡) = 𝑢2+ 2𝑡(𝑎⋅𝑢) + 𝑎2𝑡2
(2𝑎)⋅𝑥 = (2𝑎) ⋅ (𝑢𝑡 + ½ 𝑎𝑡2 ) = 2𝑡 (𝑎⋅𝑢) + 𝑎2𝑡2 = 𝑣2 − 𝑢2
𝑣2 = 𝑢2 + 2(𝑎⋅𝑥)
Where v = |v| etc.
The equations given apply to both Newton's mechanics and special relativity. The difference between Newton's mechanics and special relativity lies in the way each observer would describe the same situation. Specifically, in Newtonian mechanics, All non-accelerating observers would describe an object's acceleration with the same values and all observers agree on the value of t and the transformation rules for position. Neither is true for special relativity, which means that only relative velocity can be calculated.
VELOCITY DEPENDENT QUANTITIES:
Momentum:
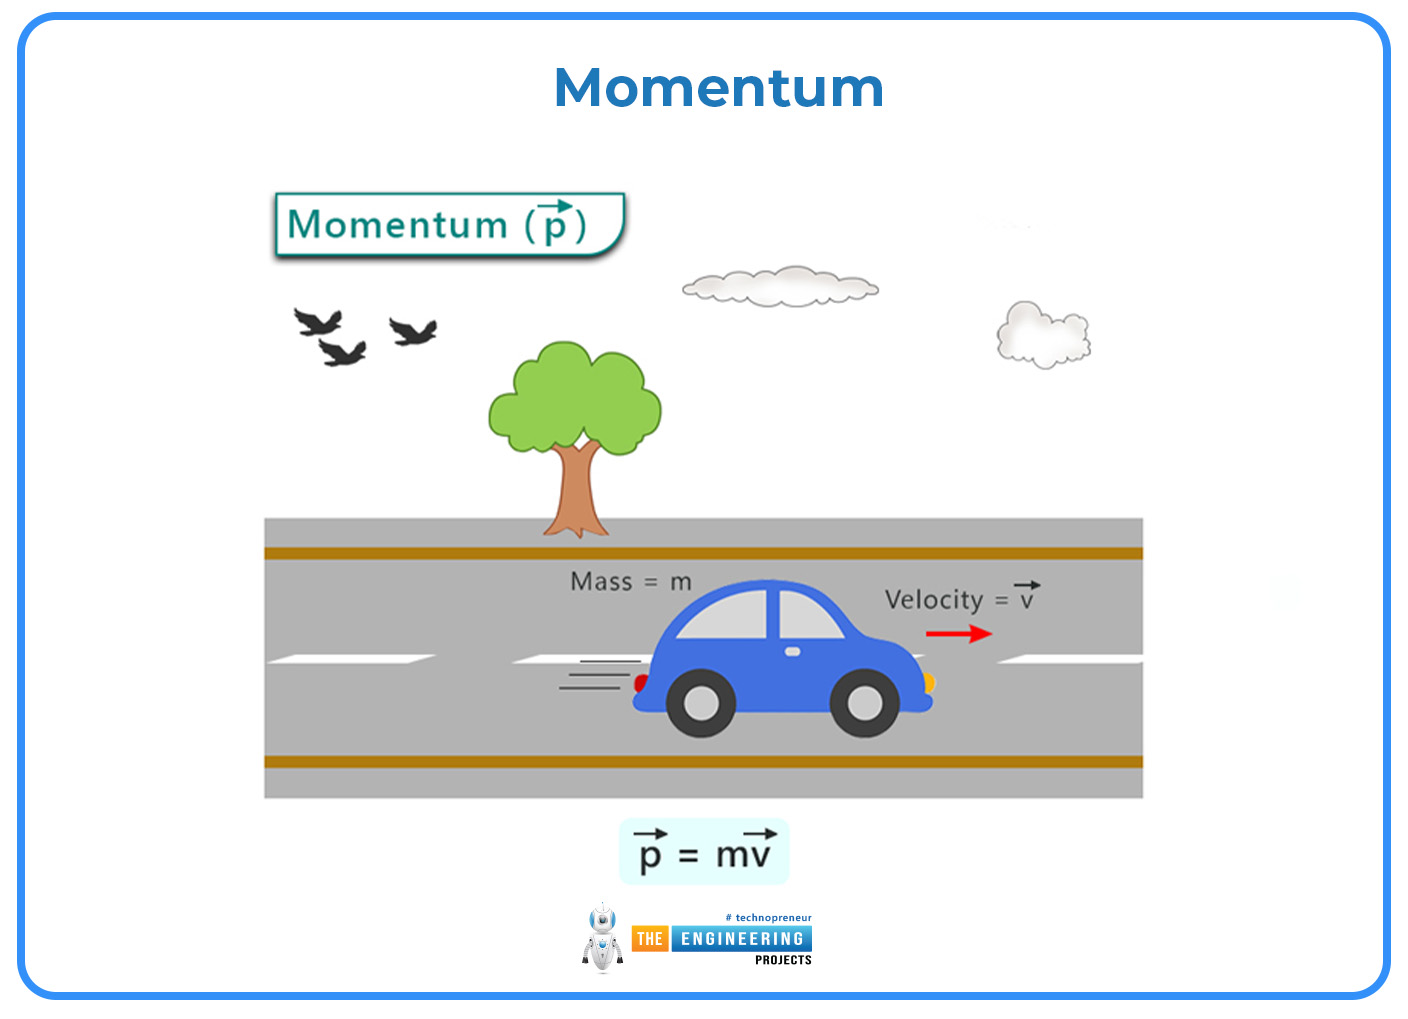
In classical mechanics, Newton's second law defines momentum , () as a vector that is the product of an object's mass and velocity, given mathematically as:
𝑝 = 𝑚𝑣
Where m is the mass of the object.
Kinetic energy:
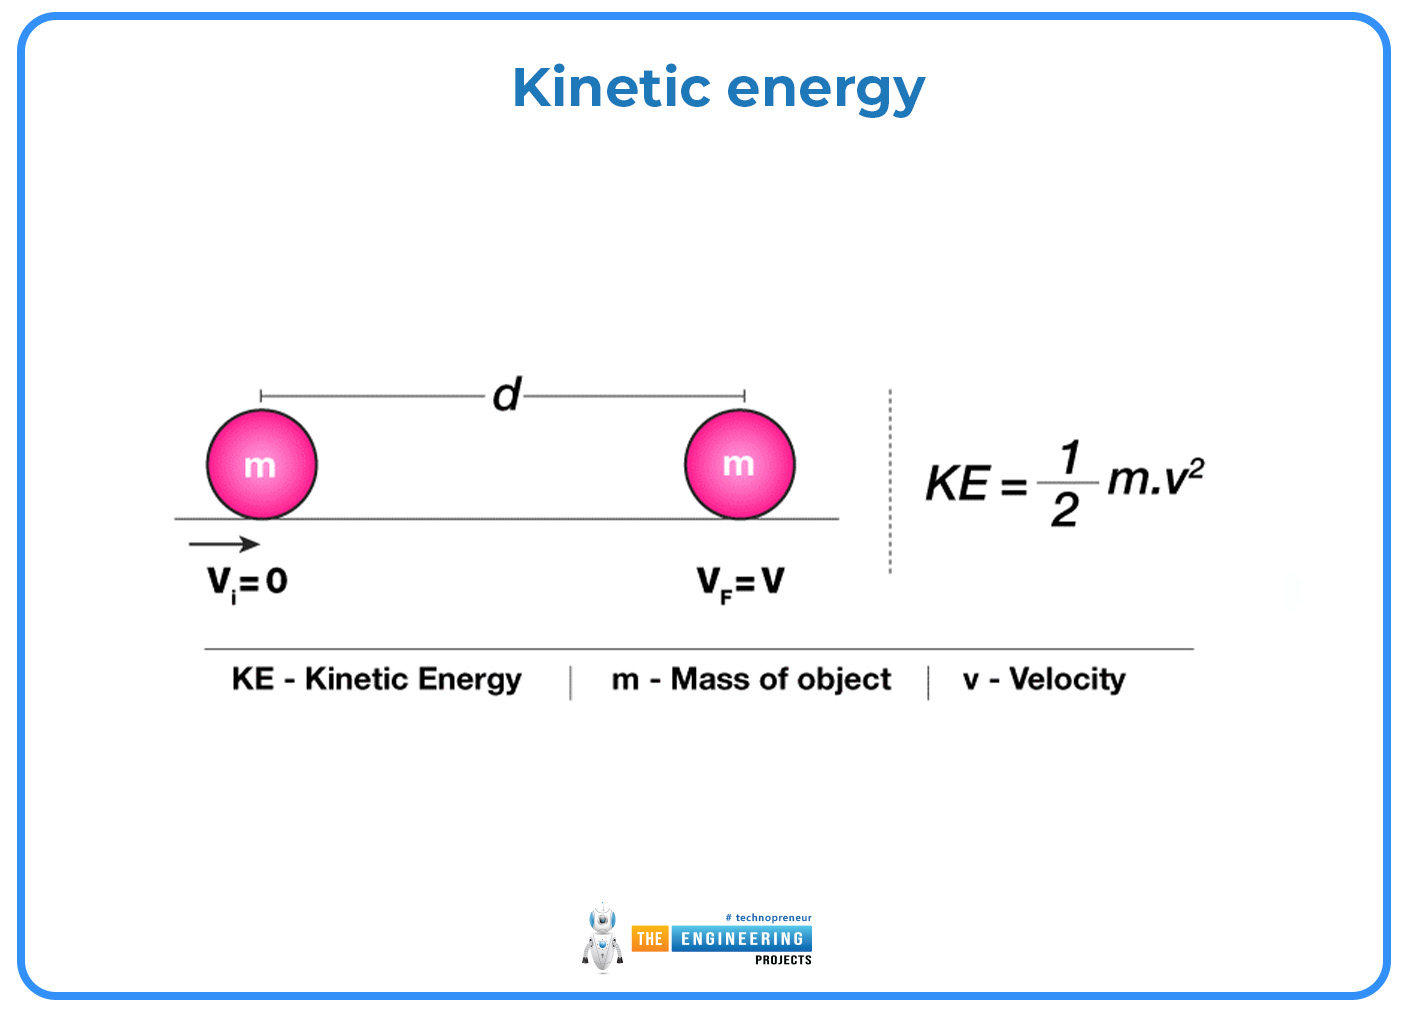
The kinetic energy of a moving object is dependent on its velocity and is given by the equation
𝐸k= 1/2 𝑚𝑣2
Where Ek is the kinetic energy, kinetic energy is a scalar quantity as it depends on the square of the velocity.
Drag (fluid resistance):
In fluid dynamics, drag is a force acting opposite to the relative motion of any object moving concerning a surrounding fluid. The drag force, 𝐹𝐷, is dependent on the square of the velocity and is given as
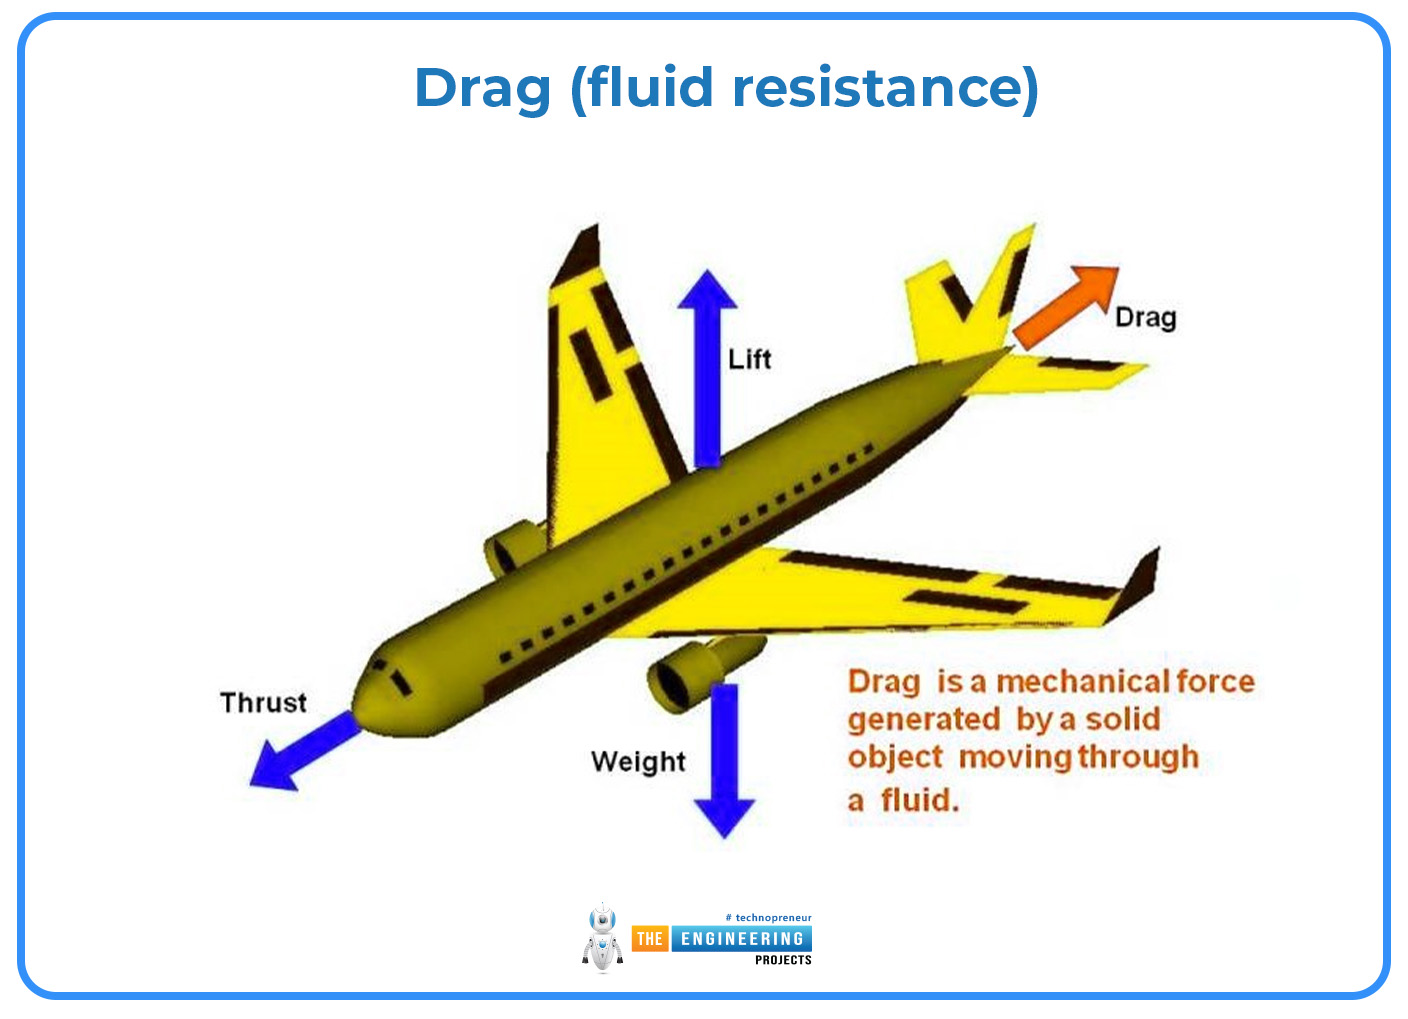
𝐹𝐷 = 1/2𝜌𝑣2 𝐶𝐷𝐴
Where
𝜌 is the fluid's density,
𝑣 is the speed of the object relative to the fluid,
𝐴 is the cross-sectional area, and
𝐶𝐷 is the drag coefficient – a dimensionless number.
Escape velocity:
Escape velocity is the minimum speed a ballistic object needs to escape from a massive body such as Earth. It represents the kinetic energy that, when added to the object's gravitational potential energy (which is always negative), is equal to zero. The general formula for the escape velocity of an object at a distance r from the centre of a planet with mass M is
𝑣e = 2GMr = 2gr
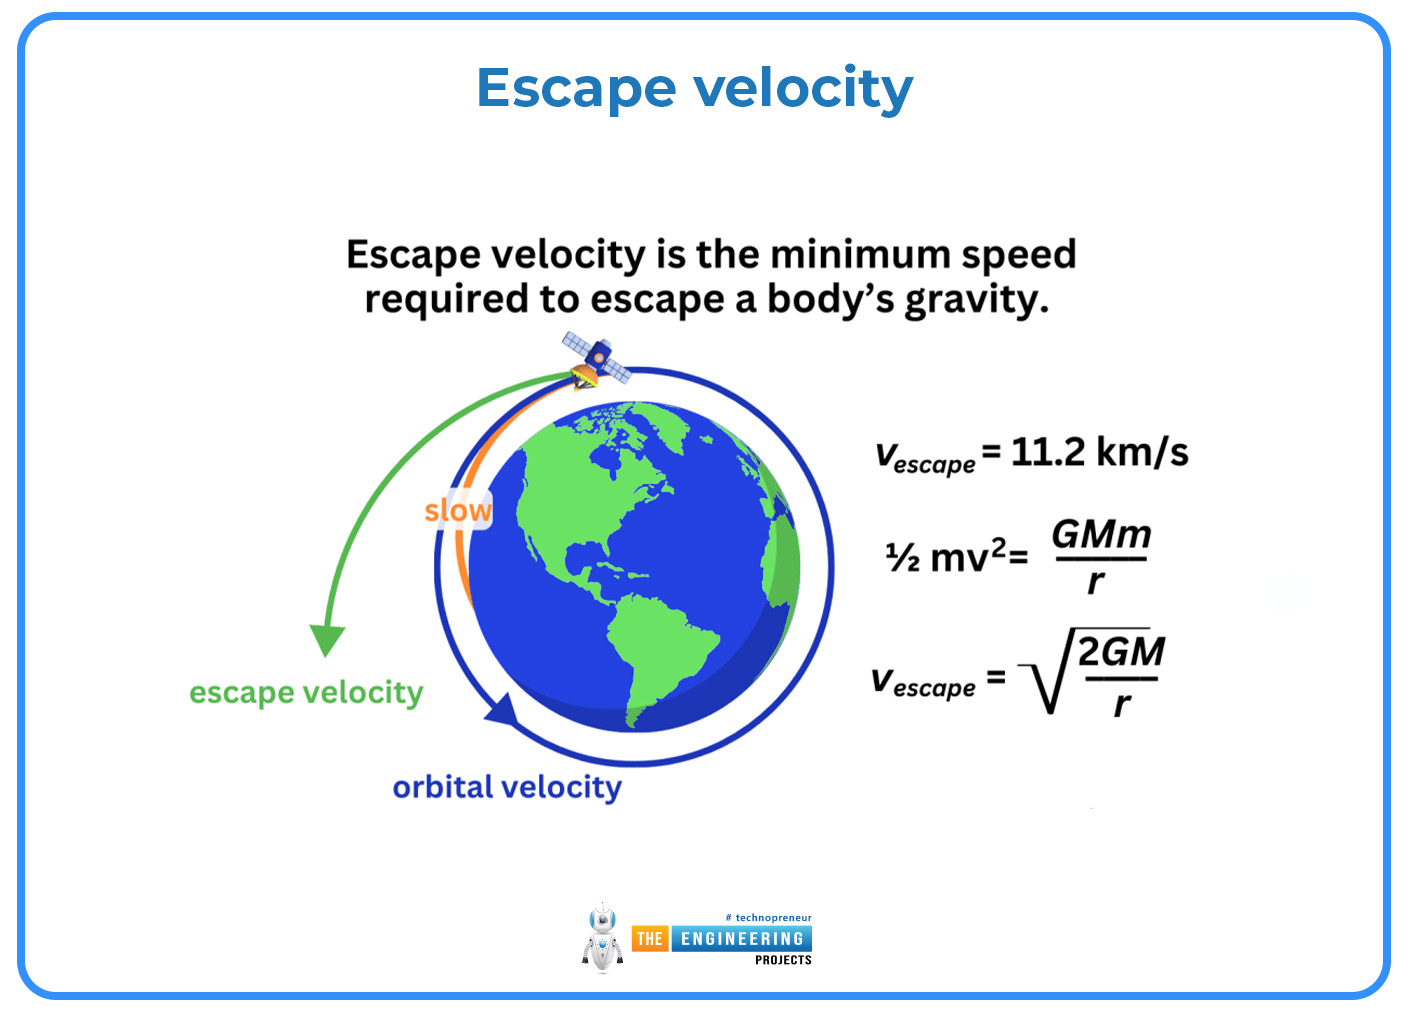
Where G is the gravitational constant and g is the gravitational acceleration. The escape velocity from Earth's surface is about 11 200 m/s and is irrespective of the direction of the object. This makes "escape velocity" (ve ) somewhat of a misnomer, as the more correct term would be "escape speed": any object attaining a velocity of that magnitude, irrespective of atmosphere, will leave the vicinity of the base body as long as it does not intersect with something in its path.
The Lorentz factor of special relativity:
In special relativity, the dimensionless Lorentz factor appears frequently, and is given by:
=11-v 2c2
Where γ is the Lorentz factor and c is the speed of light.
Relative Velocity:
Relative velocity is a measurement of velocity between two objects as determined in a single coordinate system. Relative velocity is fundamental in both classical and modern physics, since many systems in physics deal with the relative motion of two or more particles.
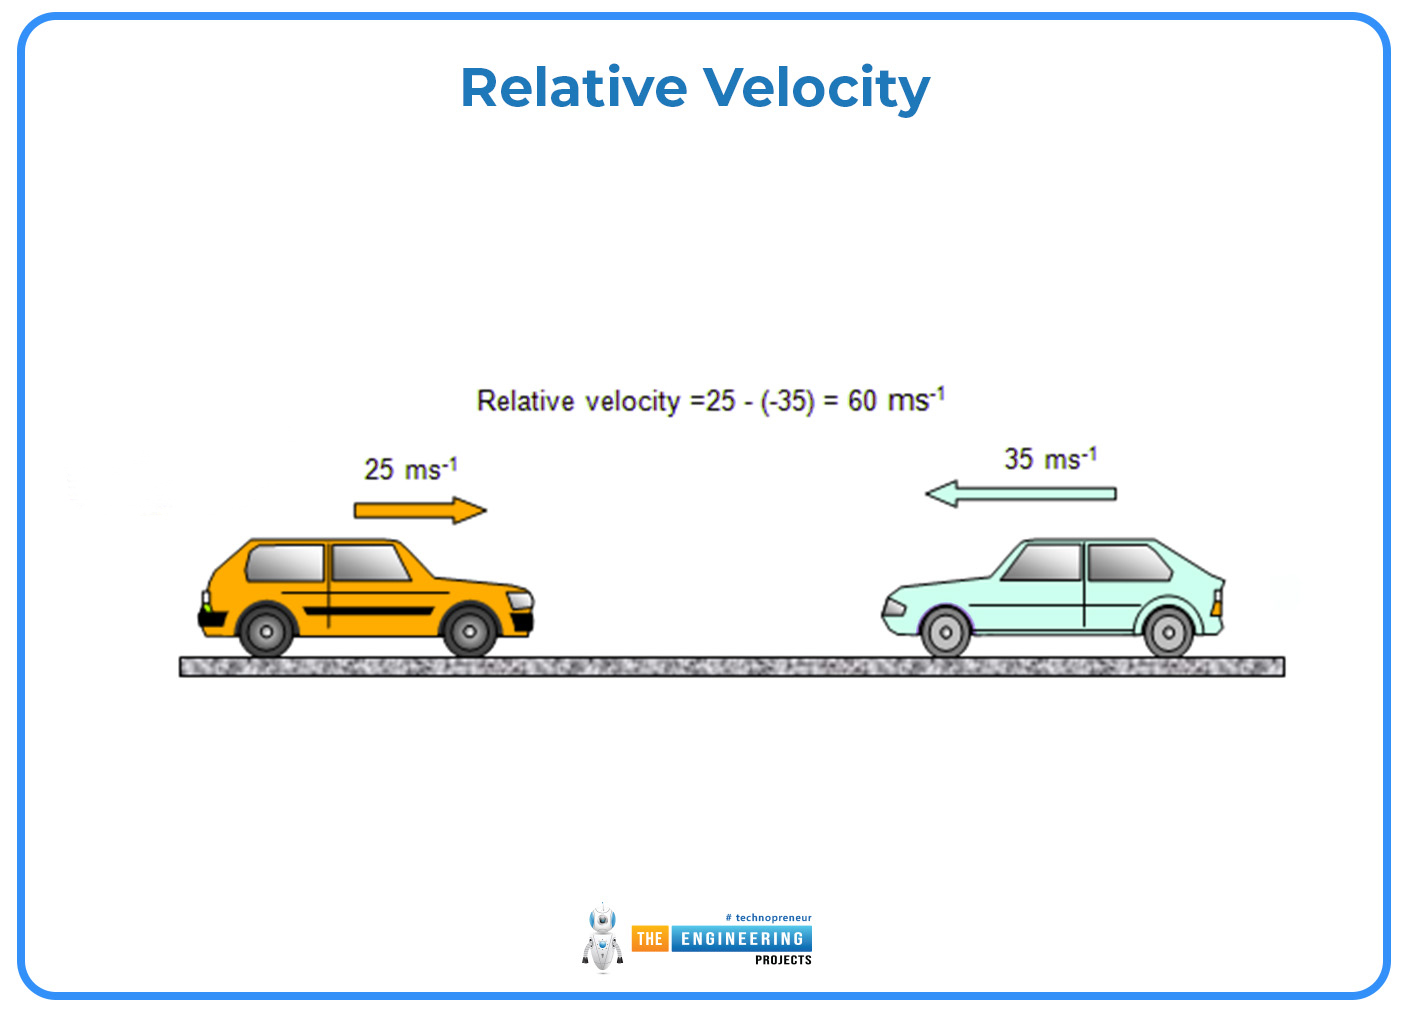
Consider an object A moving with velocity vector v and an object B with velocity vector w; these absolute velocities are typically expressed in the same inertial reference frame. Then, the velocity of object A relative to object B is defined as the difference of the two velocity vectors:
𝑣𝐴 relative to 𝐵= 𝑣 −
Similarly, the relative velocity of object B moving with velocity w, relative to object A moving with velocity v is:
𝑣𝐵 relative to 𝐴 = − 𝑣
Usually, the inertial frame chosen is that in which the latter of the two mentioned objects is at rest.
In Newton's mechanics, the relative velocity is independent of the chosen inertial reference frame. This is not the case anymore with special relativity in which velocities depend on the choice of reference frame.
Scalar velocities:
In the one-dimensional case, the velocities are scalars and the equation is either if the two objects are moving in opposite directions,
𝑣rel = 𝑣− (−𝑤),
Or, if the two objects are moving in the same direction.
𝑣rel = 𝑣− (+𝑤),
REAL-WORLD APPLICATIONS OF VELOCITY-TIME GRAPHS:
The velocity-time graph concept is crucial in physical education and has practical applications in many fields. These graphs offer crucial insights into motion dynamics, that are essential for optimising systems in industries like automotive engineering, aerospace, and sports science.
Automotive Engineering:
In automotive engineering, velocity-time graphs are very important for analysing and improving vehicle performance. These graphs are used by engineers to examine the characteristics of acceleration and braking, which are crucial to the safety and efficiency of vehicles.
Acceleration Analysis:
At the point when specialists plot the speed increase period of a vehicle, they can assess how well the motor and transmission frameworks are performing. For instance, a velocity-time graph with a more pronounced incline suggests a quicker acceleration, which is desired in high-performance vehicles. This information can be used by specialists to further develop motor tuning and upgrade gear proportions to accomplish a predominant speed increase.
Braking Performance:
Understanding the speed at which a vehicle can slow down is essential for safety. The rate of deceleration is depicted by the slope of the velocity-time graph during braking, which engineers utilise to design braking systems that offer sufficient stopping power, minimise stopping distances, and improve overall vehicle safety.
Aerospace and Aviation:
In aerospace and aviation, velocity-time graphs are utilised for analysing the dynamics of aircraft and spacecraft. These graphs play a crucial role in flight planning, performance evaluation, and safety appraisals.
Takeoff and Landing Analysis:
Significant velocity changes occur during an aircraft's takeoff and landing. Through the analysis of velocity-time graphs, engineers can ascertain the required runway length, evaluate the performance of engines and brakes, and ensure that the aircraft can safely accelerate to takeoff speed or decelerate to a stop.
Trajectory Planning:
Velocity-time graphs are utilised for spacecraft to plan trajectories and manoeuvres. These graphs play a crucial role in calculating the necessary velocity adjustments for orbit insertion, interplanetary travel, and re-entry into the Earth's atmosphere. Precise examination of these graphs is essential to guarantee the success and safety of missions.
Sports Science and Biomechanics:
Velocity-time graphs find application in sports science and biomechanics to improve athletic performance and reduce the risk of injuries.
Performance Optimization:
Velocity-time graphs are used to analyse athletes' movements like running, jumping, or swimming. For example, in sprinting, these graphs can display the rate at which an athlete achieves top speed and the duration for which it is maintained. This data can be utilised by coaches and sports scientists to customise training regimens, focusing on enhancing acceleration, speed endurance, or strategies for pacing.
Injury Prevention:
On velocity-time graphs, abrupt changes in velocity can be used to identify potentially dangerous motions that raise the risk of damage. For example, abrupt acceleration or deceleration can put stress on the joints and muscles. Trainers and physiotherapists can create methods and exercises to improve movement efficiency and lower the risk of injury by examining these patterns.
Development And Research:
Velocity-time graphs are essential for motion-related activities in research and development. These graphs offer a precise and measurable depiction of motion, whether one is researching the mobility of biological entities or particles in physics.
Experimental Physics:
Velocity-time graphs in lab settings aid researchers in comprehending how things move under varied stresses. They are utilised, for instance, to research the consequences of air resistance, friction, and gravitational forces.
These real-world applications underscore the importance of velocity-time graphs in various domains. They are a versatile tool for analysing and optimising motion, offering valuable insights that contribute to technological advancements, safety improvements, and better performance in numerous fields. Understanding how to interpret and apply these graphs is a vital skill for professionals in physics, engineering, and beyond.
IMPLICATIONS AND CONSIDERATIONS IN INTERPRETING VELOCITY-TIME GRAPHS:
Velocity-time graphs are useful tools for studying motion, but effective interpretation necessitates a deep comprehension of their subtleties. It is necessary to consider several obstacles and issues to prevent misunderstandings and get valuable information from these graphs.
Understanding the Slope and Area Concepts
Slope Interpretation:
The slope of a velocity-time graph represents acceleration. However, understanding what the slope conveys in different contexts is crucial. A common challenge is distinguishing between positive, negative, and zero slopes:
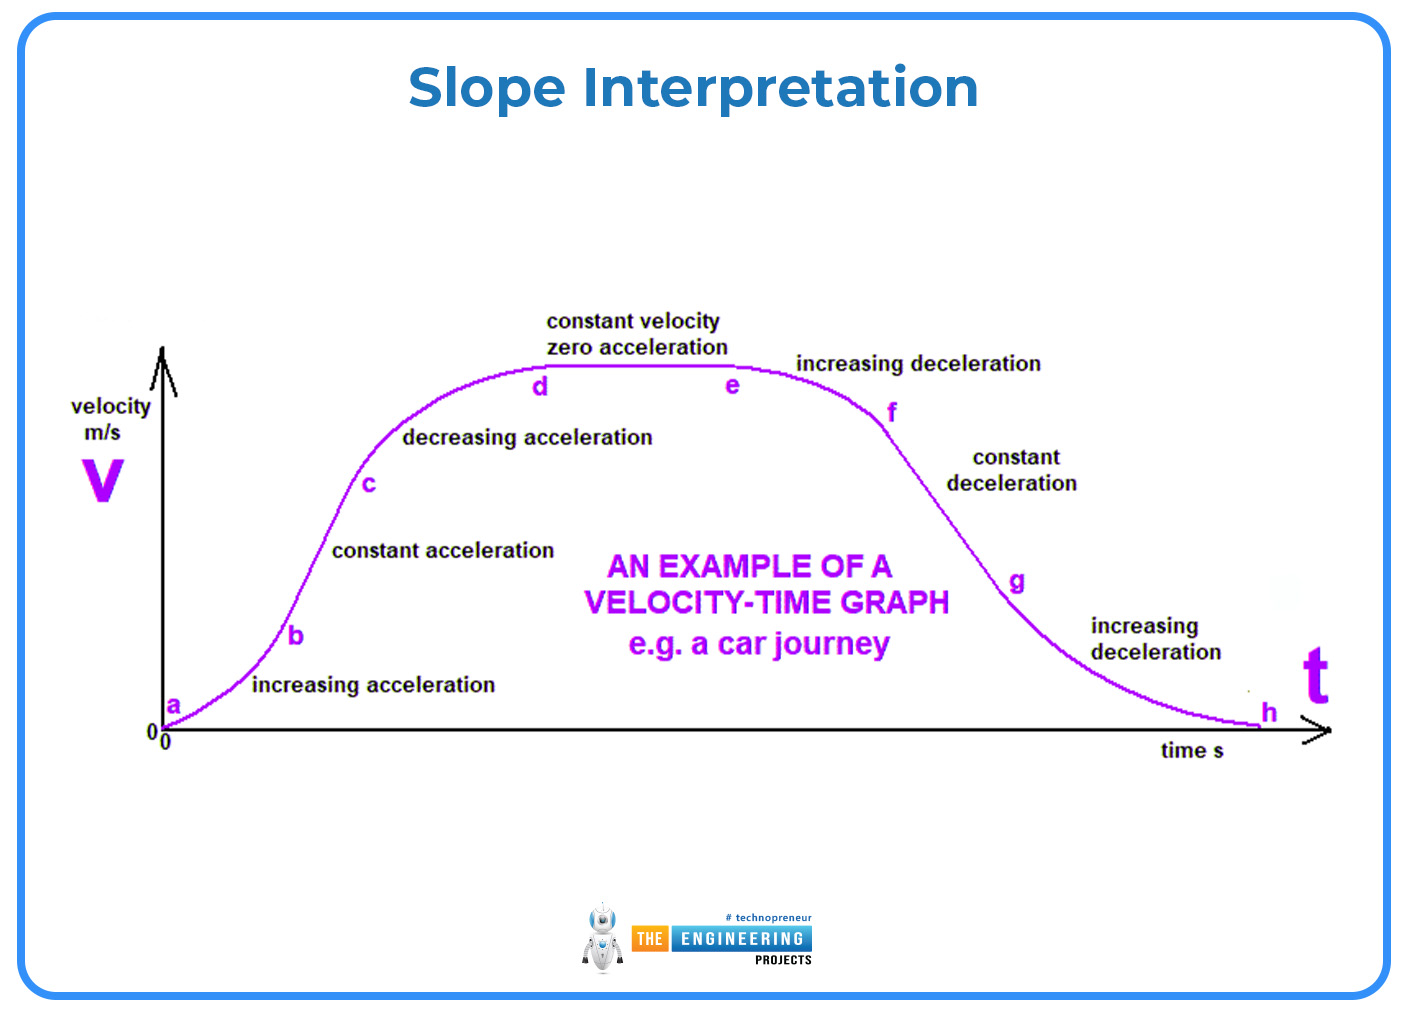
Acceleration is indicated by a positive slope. The object is speeding up in the positive direction.
Deceleration is indicated by a negative slope. The object may be slowing down or speeding up in the negative direction depending on the context.
A slope with zero slope indicates that there is no acceleration and constant velocity.
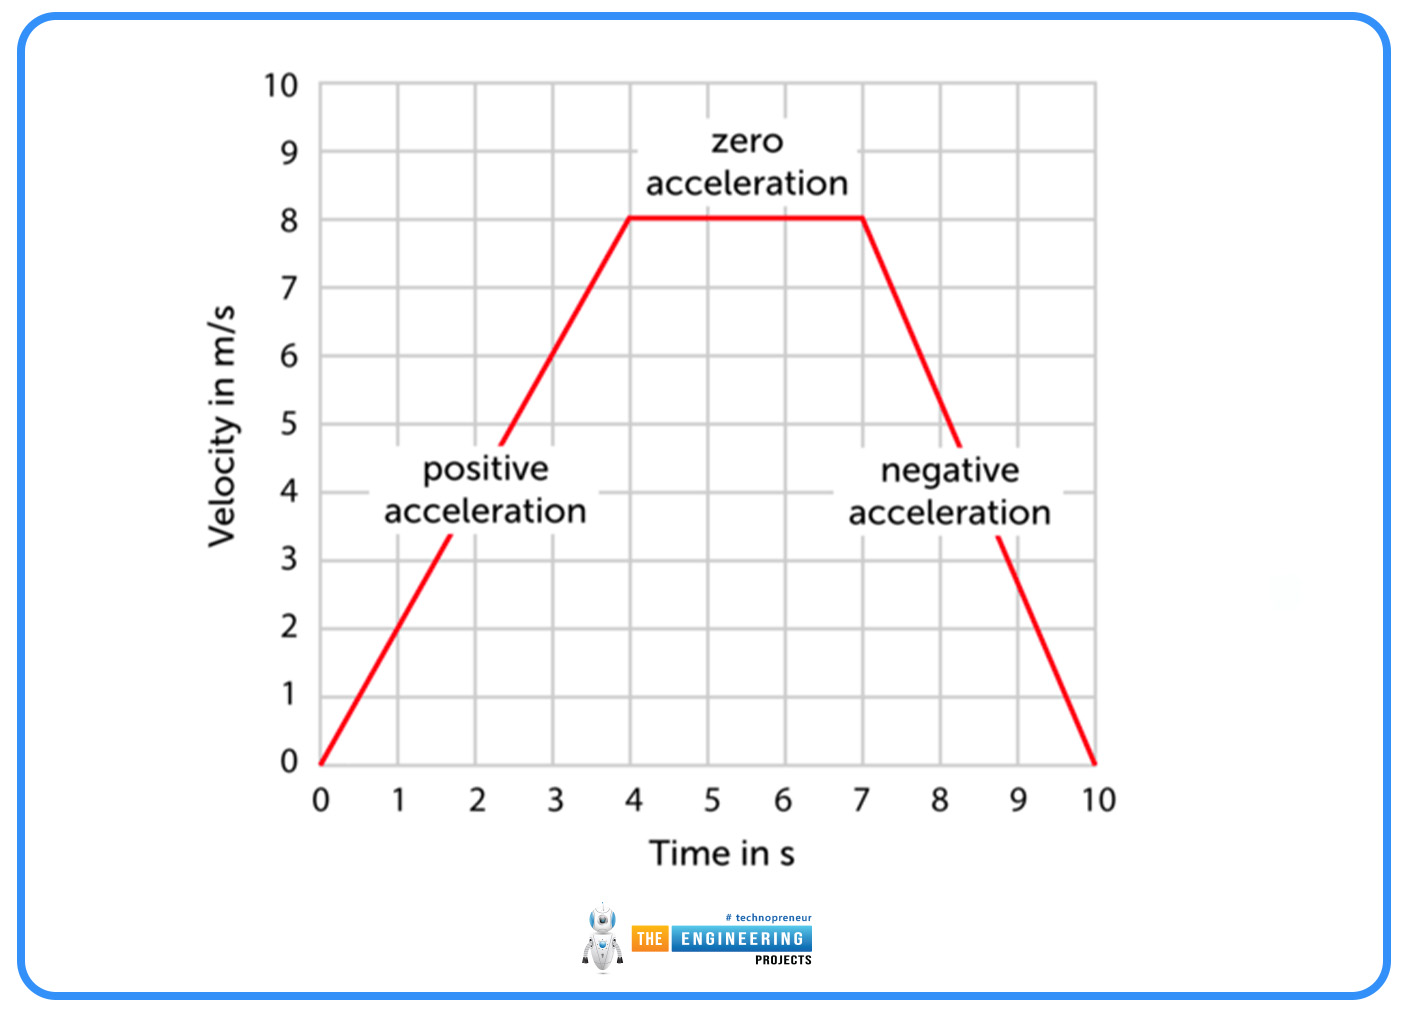
Misinterpretation can happen if the reference direction is not clearly defined or if the acceleration nature (speeding up or slowing down) is not comprehended.
Area Under the Curve:
On a velocity-time graph, displacement is represented by the area under the curve rather than distance. This distinction is essential:
A vector quantity that takes motion direction into account is displacement. The value may be zero, negative, or positive, contingent upon the initial and final points.
Distance is a scalar number that is always positive and cumulative and represents the whole path length travelled.
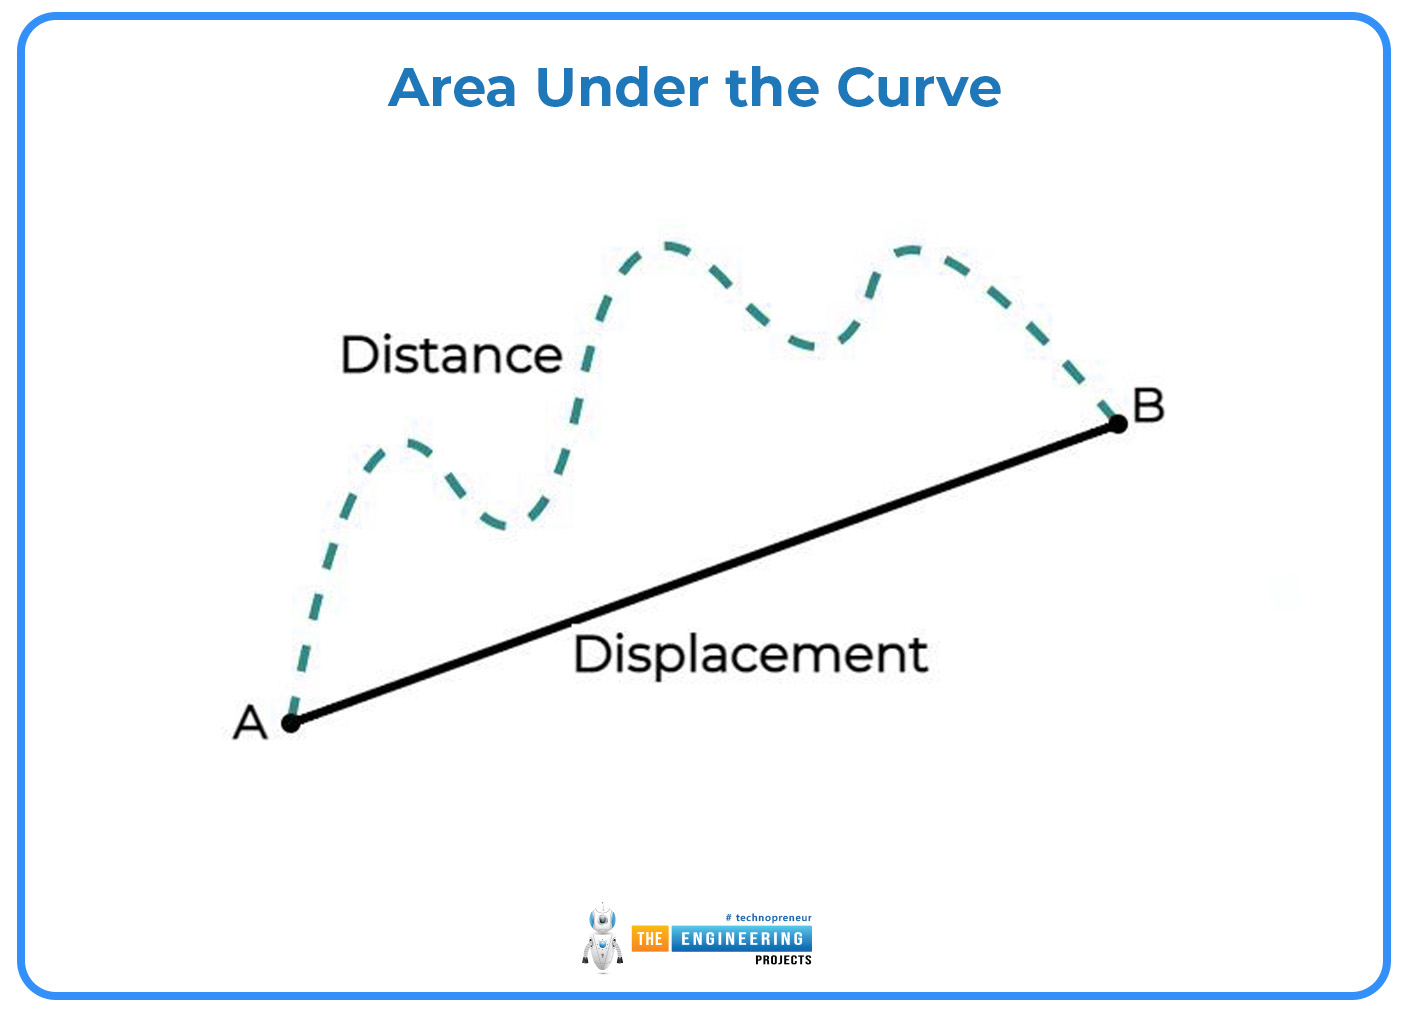
One typical error that might result in inaccurate conclusions regarding an object's mobility is to interpret the area under the graph as the total distance travelled without taking directionality into account.
Handling Negative Velocities:
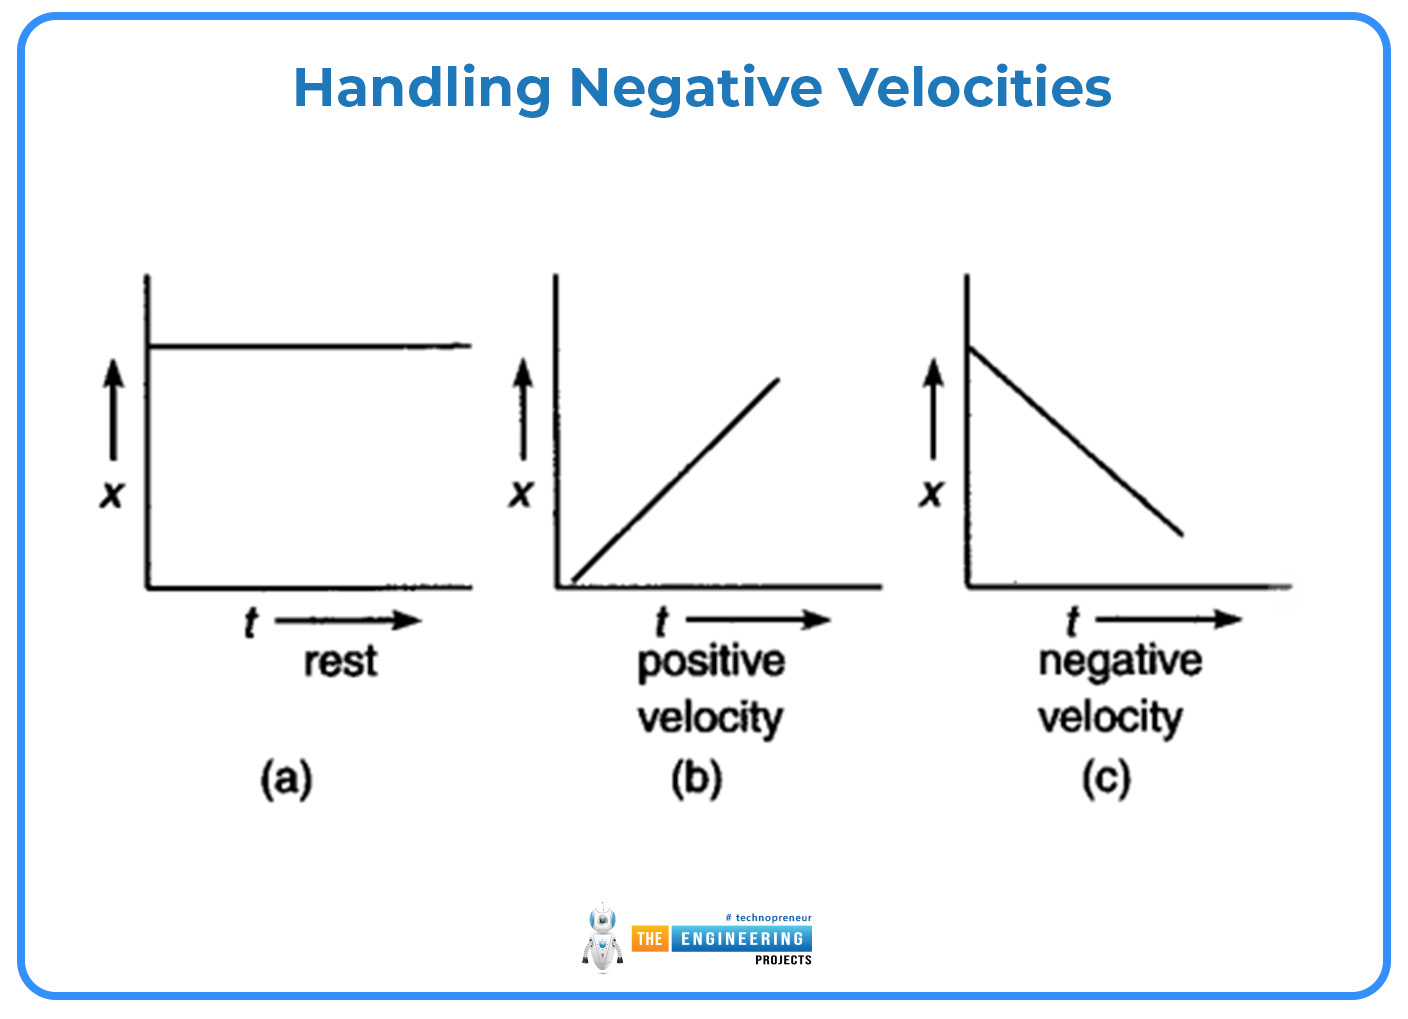
Negative numbers on velocity-time graphs denote mobility in the opposite direction from the positive reference direction. It is crucial to know how to interpret negative velocities, particularly in situations, where there is back-and-forth or circular motion.
Reversing Direction:
An item has reversed its direction when its velocity shifts from positive to negative (or vice versa). Understanding changes in motion and computing total displacement depends on this reversal point.
Calculating Total Displacement vs. Total Distance:
The algebraic sum of the regions above and below the time axis must be taken to get total displacement. However, the magnitudes of every area (regardless of direction) are added up to the entire distance.
Complex Motions and Non-Uniform Acceleration:
Motion is frequently complicated and may entail non-uniform acceleration in real-world applications. It takes extensive investigation to interpret velocity-time graphs for such motions:
ADVANCED APPLICATIONS AND INNOVATIONS USING VELOCITY-TIME GRAPHS:
Velocity-time graphs are being used in more sophisticated ways in research and engineering, expanding their conventional uses as science and technology improve.
Autonomous Systems and Robotics:
Autonomous vehicles and robots' control systems rely heavily on velocity-time graphs.
Navigation and Control:
Path planning, obstacle avoidance, and navigation in autonomous vehicles all depend on an understanding of velocity over time. These systems use velocity-time data to generate safe and effective routes, modify speed in response to changing circumstances, and guarantee seamless stops and starts.
Robotic Motion Analysis:
Velocity-time graphs are used in robotics to optimise the movement of robotic arms and other moving parts. Robots may execute delicate tasks, such as assembly in manufacturing or surgery in medical applications, with great accuracy and dependability when their acceleration and velocity are precisely controlled.
Biomechanical Research:
Biomechanics and Prosthetics:
Human movement is studied through the use of velocity-time graphs in biomechanical research, which greatly influences the development of prosthetics and orthotics. Engineers and medical professionals can create prosthetic limbs that more closely emulate natural gait patterns by analysing their velocity profiles, which can enhance comfort and functionality for users.


