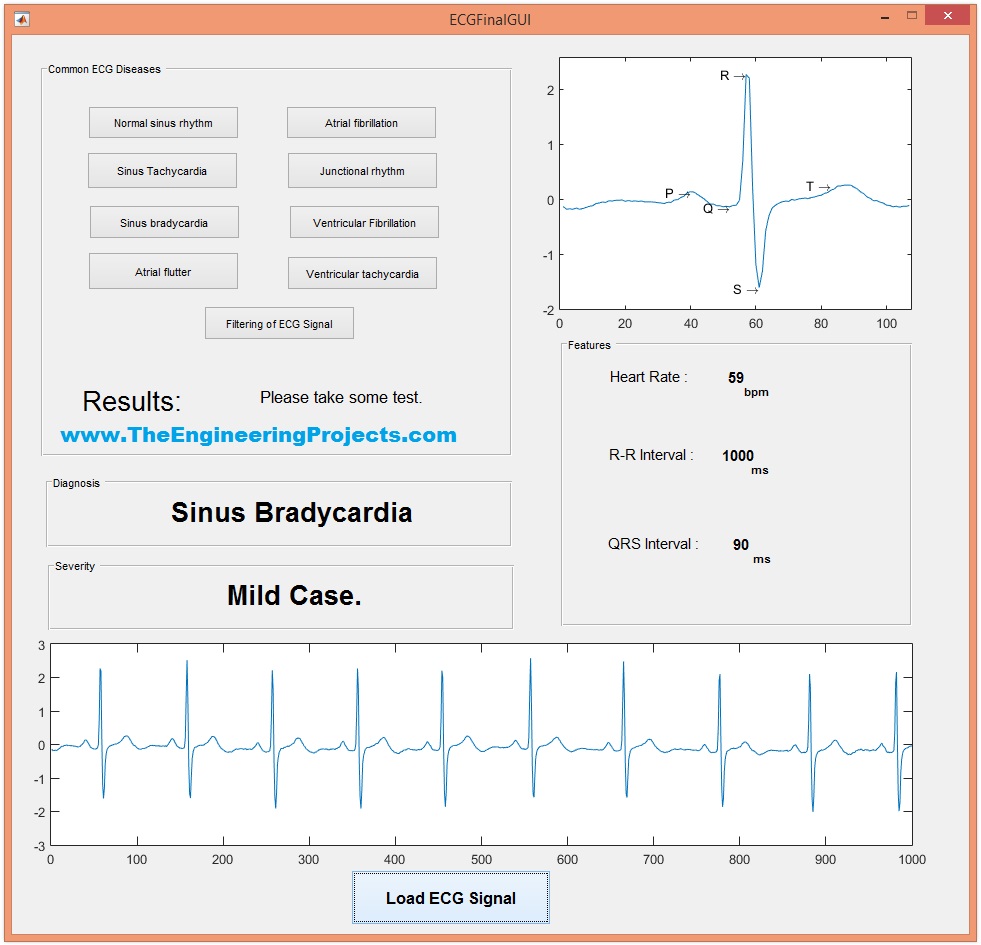
Moreover, I have also designed a user friendly GUI which is quite easy to operate and you can simulate any kind of ECG data on this ECG Simulator. I have also extracted ECG features and then showed them separately. I have taken ECG data from PhsioBank website. Before buying this project must read this tutorial completely and also watch the video given at the end of this tutorial so that you are sure what you are buying. So, let's get started with ECG Simulation using MATLAB:
ECG Simulation using MATLAB
- You can buy this ECG Simulation using MATLAB by clicking the below button:
- When you buy this Simulation then you will get a lot of files and you need to run the ECGFinalGUI.m file.
- When you run this file, a GUI will open up as shown in below figure:
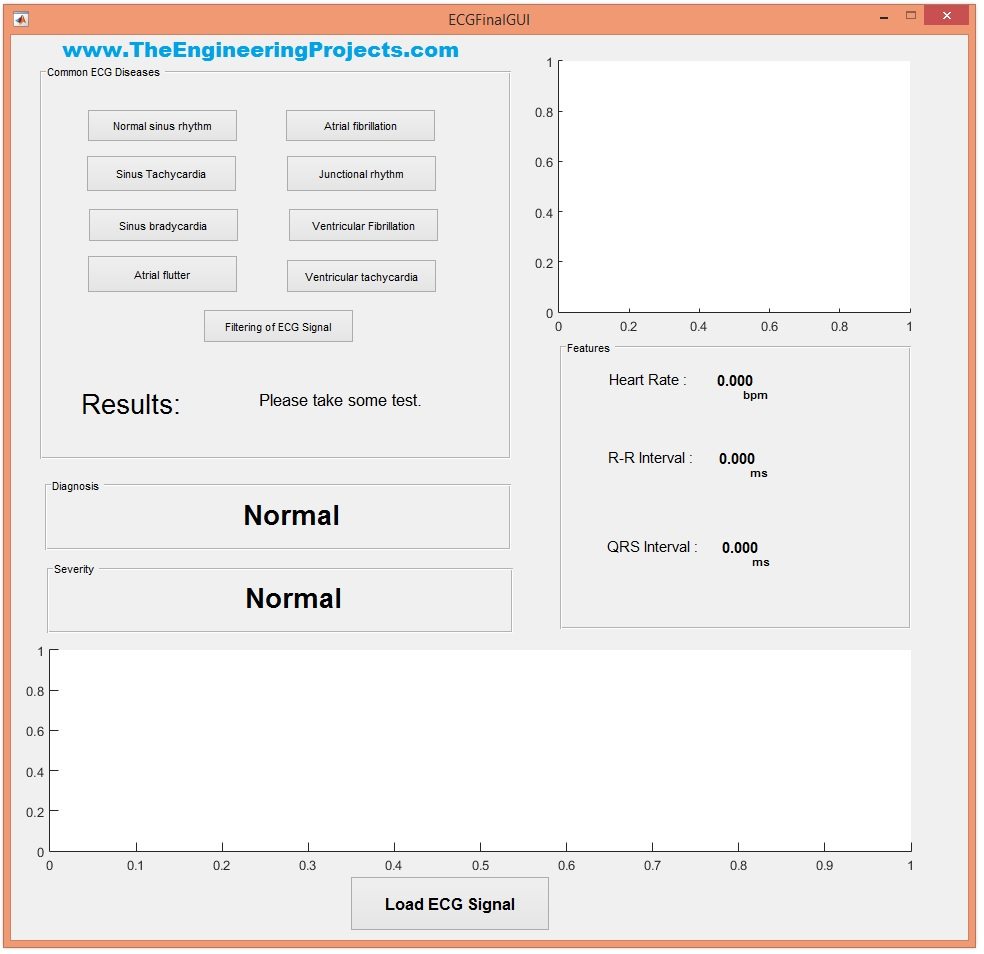
- As you can see this GUI contains two portions, the first portion is the Common ECG Diseases section:
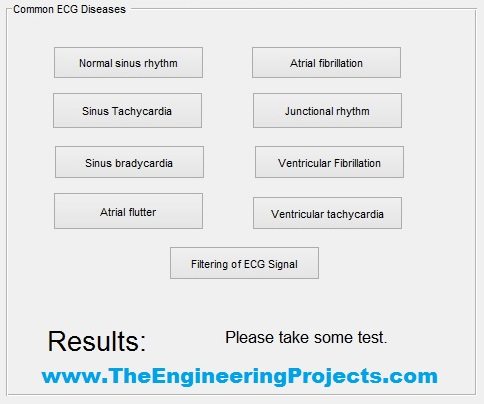
- In this section, I have designed some basic ECG diseases signals.
- From the ECG curve, doctors find the disease so I have designed few curves which will show different ECG diseases.
- Like if the patient is suffering from Atrial Flutter then its curve will be something as shown in below figure and it comes when you click the Atrial Flutter button:

- I have designed curves of six ECG Diseases which are as follows:
- Normal Sinus Rhythm
- Junctional Rhythm
- Atrial Fibrillation
- Ventricular Fibrillation
- Ventricular Tachycardia
- Sinus Tachycardia
- Sinus Bradycardia
- Atrial Flutter
- You can check their ECG graphs by clicking each of these buttons.
- The last button in the common ECG Diseases is for filtering of ECG Signals.
- When you click this button then the program will filter the real ECG signal and remove noise from it as shown in below figure:

- Now let's have a look at the feature extraction from ECG Signal.
- I have downloaded around 12 signals from PhsioBank Website and here's my settings on this website:
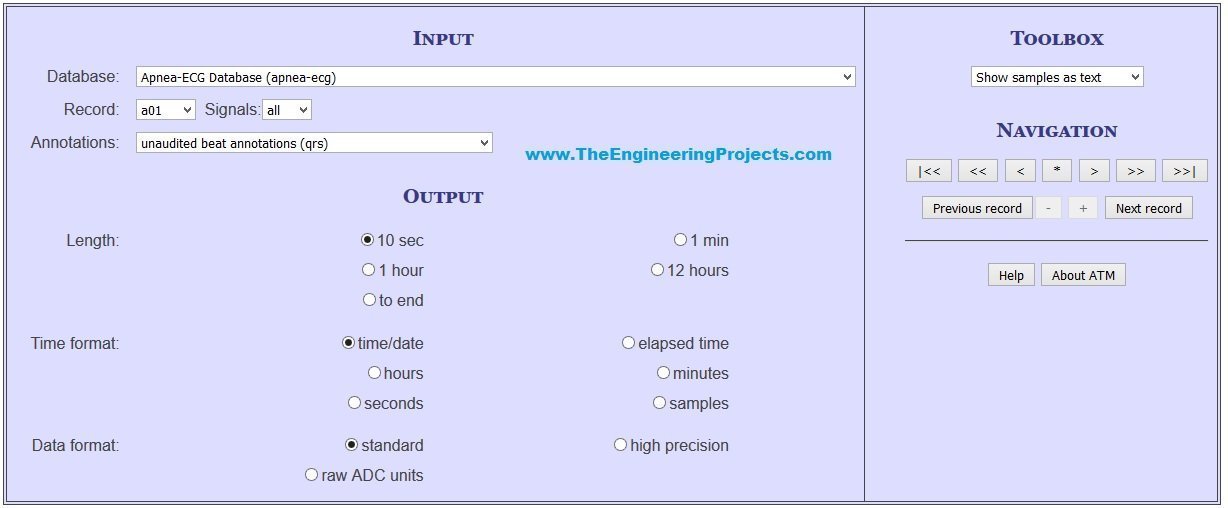
- I have downloaded each signal of 10 sec duration as shown in above figure and saved it in txt form and then copied the data in txt files.
- So, this simulation contains total 12 signals.
- Now once you saved your signal in txt format now you need to use the Load ECG Signal button on the GUI and it will ask for browse.
- So, select your ECG signal and it will show its features like Heart Rate, R-R interval, QRS interval etc as shown in below figure:
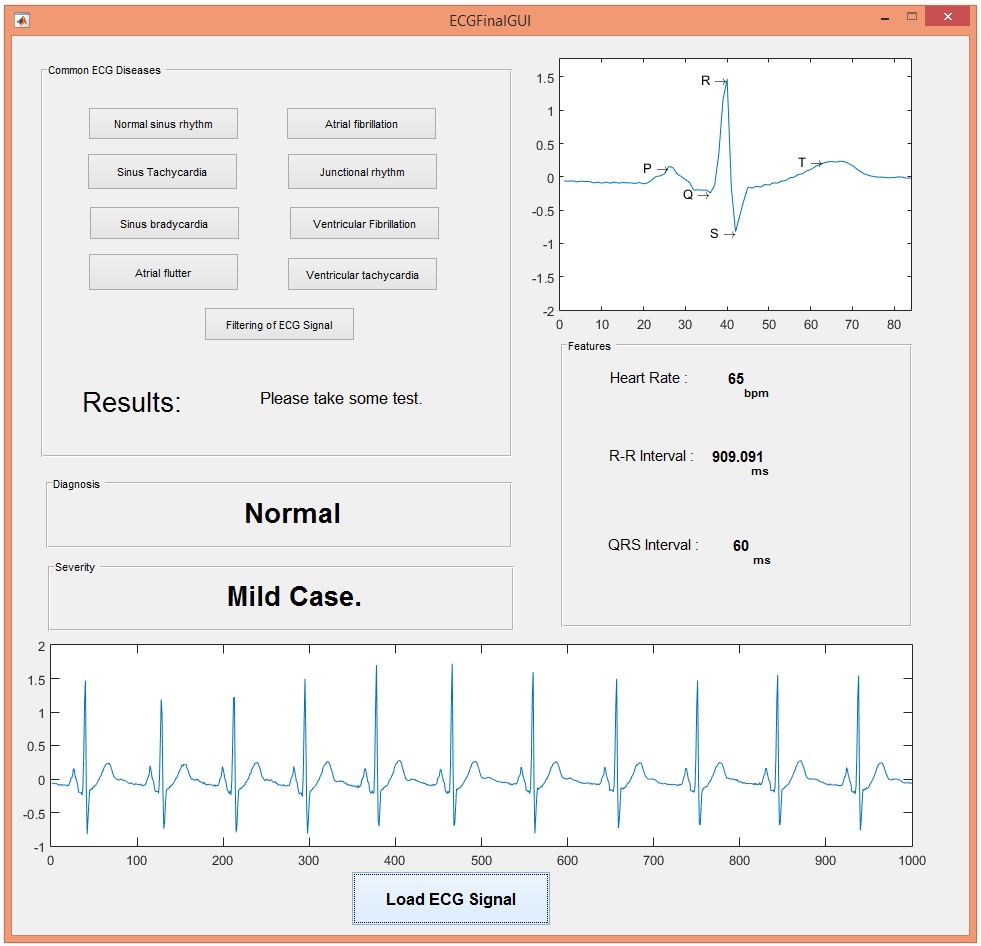
- You can see in the above figure that as I selected the ECG signal, first of all GUI extracted the first ECG curve and shown it separately in the above window.
- After that I have extracted the P, Q, R, S and T peaks.
- After that I have also extracted the Heart Rate, R - R interval and QRS interval.
- Next phase is to diagnose the disease, which is Normal in this case.
- If this patient had some disease then it will be displayed in this Diagnosis section.
- Next section is Severity section, in which I have displayed the Condition of the Patient i.e. its severe or mild etc.
- So, let me load some other ECG signal and let's have a look at its results:

- Now in this set of ECG data we have detected that the patient is suffering with Sinus Bradycardia.
- The below video will give you a better idea of How this project works, so before buying it must watch this video first:


