This project is designed in MATLAB and I have tested it on MATLAB 2009 and MATLAB 2014 and it works fine on both of them. Code is given below in this tutorial for download. f you got problem in it then ask in comments and I will try to resolve them. So, let's get started with DTMF decoder in MATLAB.
DTMF Decoder using MATLAB
- You can download the complete code by clicking the below button:
- In this download package, you will get three files and you need to run the file named as decoder.m.
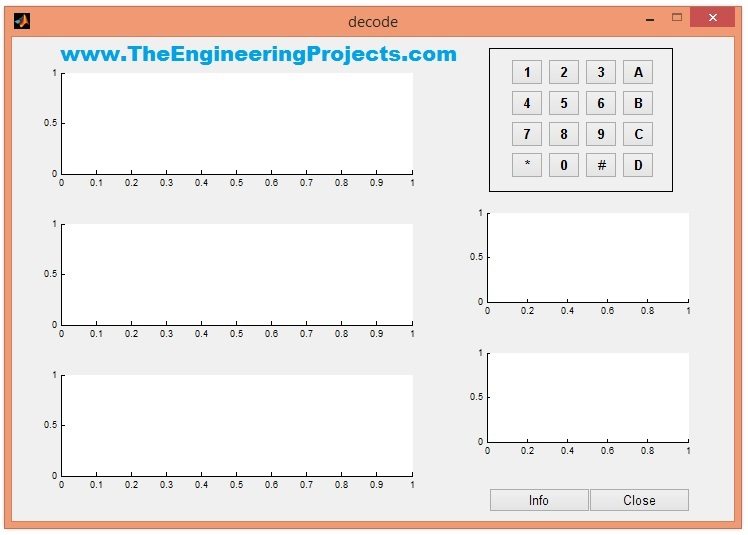
- When you run the file named as decoder.m, it will start the GUI which will look something as shown in below figure:

- That's the GUI used for DTMF Decoder using MATLAB.
- You can see a keypad is shown in the above GUI, now I have assigned a specific tune to each of these buttons and the code for assigning this tune is as follows:
t=[0:0.000125:.05];
fs=8000;
f1=770;f2=1477;
y1=.25*sin(2*pi*f1*t);
y2=.25*sin(2*pi*f2*t);
y=y1+y2;sound(y,fs)
- So, you can see in the above code that I have generated a sine wave and then created a sound using that sine wave.
- So, we have such sounds assigned to each of these buttons.
- Now once button is pressed, the respective sound will be activated and rite after that sound, I have added a subroutine for decoding that sound.
- This subroutine is placed in a separate file named as subdecode.m.
- This subdecode.m is responsible for DTMF decoding and its code is as follows:
axes(handles.fig1);
plot(t,y);
set(handles.fig1,'XMinorTick','on');
title('DTMF Input');xlabel('Time');
ylabel('Amplitude');grid;

rmain=2048*2;rmag=1024*2;
cn=9;cr=0.5;
cl=.25;ch=.28;
[b,a]=cheby1(cn,cr,cl);
yfilt1=filter(b,a,y);
h2=fft(yfilt1,rmain);
hmag2=abs(h2(1:rmag));
[b1,a1]=cheby1(cn,cr,ch,'high');
yfilt2=filter(b1,a1,y);
h3=fft(yfilt2,rmain);
hmag3=abs(h3(1:rmag));

axes(handles.fig2);
plot(yfilt1);grid;
title('Filtered Low Freq. Signal');
xlabel('Time');ylabel('Amplitude');

axes(handles.fig3);
plot(yfilt2);grid;
title('Filtered High Freq. Signal');
xlabel('Time');ylabel('Amplitude');

hlow=fft(yfilt1,rmain);
hmaglow=abs(hlow);
axes(handles.fig4);
plot(hmaglow(1:rmag));
title('FFT Low Pass');grid;
xlabel('Time');ylabel('Amplitude');

hhigh=fft(yfilt2,rmain);
hmaghigh=abs(hhigh);
axes(handles.fig5);
plot(hmaghigh(1:rmag));
title('FFT High Pass');grid;
xlabel('Time');ylabel('Amplitude');

m=max(abs(hmag2));n=max(abs(hmag3));
o=find(m==hmag2);p=find(n==hmag3);
j=((o-1)*fs)/rmain;
k=((p-1)*fs)/rmain;

if j<=732.59 & k<=1270.91;
   disp('---> Key Pressed is 1');
   elseif j<=732.59 & k<=1404.73;
      disp('---> Key Pressed is 2');
   elseif j<=732.59 & k<=1553.04;
      disp('---> Key Pressed is 3');
   elseif j<=732.59 & k>1553.05;
      disp('---> Key Pressed is A');
   elseif j<=809.96 & k<=1270.91;
      disp('---> Key Pressed is 4');
   elseif j<=809.96 & k<=1404.73;
      disp('---> Key Pressed is 5');
   elseif j<=809.96 & k<=1553.04;
      disp('---> Key Pressed is 6');
   elseif j<=809.96 & k>1553.05;
      disp('---> Key Pressed is B');
   elseif j<=895.39 & k<=1270.91;
      disp('---> Key Pressed is 7');
   elseif j<=895.39 & k<=1404.73;
      disp('---> Key Pressed is 8');
   elseif j<=895.39 & k<=1553.04;
      disp('---> Key Pressed is 9');
   elseif j<=895.39 & k>1553.05;
      disp('---> Key Pressed is C');
   elseif j>895.40 & k<=1270.91;
      disp('---> Key Pressed is *');
   elseif j>895.40 & k<=1404.73;
      disp('---> Key Pressed is 0');
   elseif j>895.40 & k<=1553.04;
      disp('---> Key Pressed is #');
   elseif j>895.40 & k>1553.05;
      disp('---> Key Pressed is D');
end
- Now you can see in this code we are applying FFT on each of these sound signals and then comparing them to get our required button press.
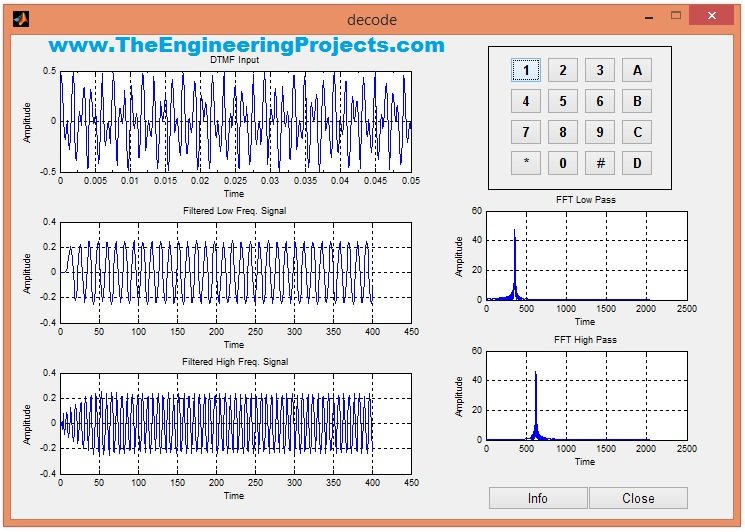
- Now, when I press any of these buttons then the GUI will look something as shown in below figure:

- You can see in the above figure that first graph is showing the DTMF input, which is actual signal which I have converted to sound on button press.
- The second graph is showing the Filtered Low Frequency Signal while the third one is showing the Filtered High Frequency Signal.
- The two graphs on the right side are showing the Amplitude of FFT Low Pass and FFT High Pass.
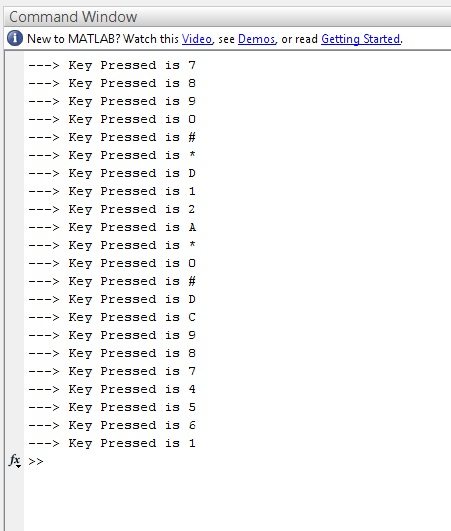
- Now if you have a look at the Command window of MATLAB then it will give you the button pressed as shown in below figure:

- These are the buttons which I have pressed while testing it and it has given me each time which button is pressed.
- Here's the video which will give you better idea of How this DTMF decoder using MATLAB is working.


