Convolution is an important technique and is used in many simulating projects. It has a vital importance in image processing. So, today we are gonna do convolution in MATLAB and will check the output. You should also check Image Zooming with Bilinear Interpolation in MATLAB in which we have used correlation technique which is quite similar to convolution. It will give you a better idea of convolution, I recommend you to read their difference. Anyways, coming back to our today's Convolution Calculator, let's start its designing:
Convolution Calculator in MATLAB
- MATLAB has a built in command for convolution using which we can easily find the convolution of two functions.
- Syntax of this builtin convolution command is v=conv(x,h) where x and h are the input functions while v is our output.
- In my code I have used this builtin function as well as I have also design a small algorithm for calculating the convolution using its formula.
- After finding both the convolutions, I have simply compared them by plotting them on graph so that we can also verify that our result is correct.
- You can use this convolution calculator to find convolution of any two functions.
- So, first of all, copy this code and paste it in your m file and run it in your MATLAB:
clc
close all
clear all


x=input('enter the sequence, x(n)=')
h=input('enter the sequence, h(n)=')

m=length(x);
n=length(h);
subplot(4,1,1)
stem(1:m,x,'fill','r')
grid on;
title('input sequence, x(n)=')
xlabel('time n------>')
ylabel('amplitude----->')

subplot(4,1,2)
stem(1:n,h,'fill','r')
grid on;
title('impulse sequence, h(n)=')
xlabel('time n------>')
ylabel('amplitude----->')
%------linear convolution using inbuilt command------------------------%
v=conv(x,h)
l=m+n-1;
subplot(4,1,3)
stem(1:l,v,'fill','r')
grid on;
title('output sequence using inbuilt command, v(n)=')
xlabel('time n------>')
ylabel('amplitude----->')
%--------linear convolution using 'for' loop------------------------------%
X=zeros(1,l);
H=zeros(1,l);
X(1:m)=x;
H(1:n)=h;
for i=1:l
    Y(i)=0;
    for j=1:i
        Y(i)=Y(i)+X(j)*H(i-j+1);
    end
end
Y
subplot(4,1,4)
stem(1:l,Y,'fill','r')
grid on;
title('output sequence using loop, Y(n)=')
xlabel('time n------>')
ylabel('amplitude----->')
- The above code for convolution calculator is quite self explanatory but let me explain it a little.
- First of all, I am asking for inputs from user and they are saved in variables named as x and h.
- After that I am plotting them using stem function.
- In the next section, I have used the default MATLAB command for Convolution and calculated the convolution of x and h and saved it in v.
- Next I applied my simple algorithm and calculated convolution of x and h and saved it in Y and also plotted it.
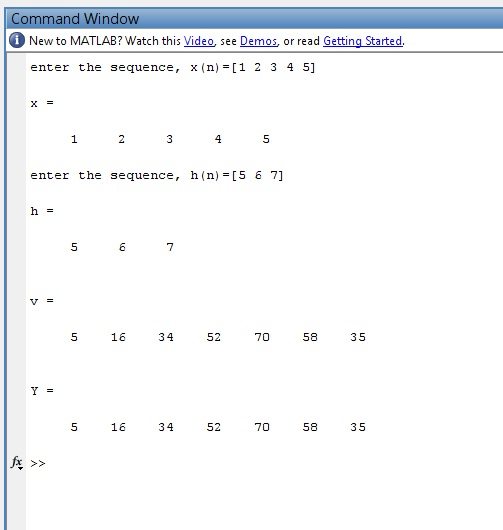
- Once you run the simulation and give your input functions, you will get the below results:

- You can see in the above figure that I have given two inputs x and h and MATLAB Convolution Calculator calculated the convolution and gave us v and Y.
- v is calculated by default MATLAB command while the Y is calculated by our small convolution algorithm.
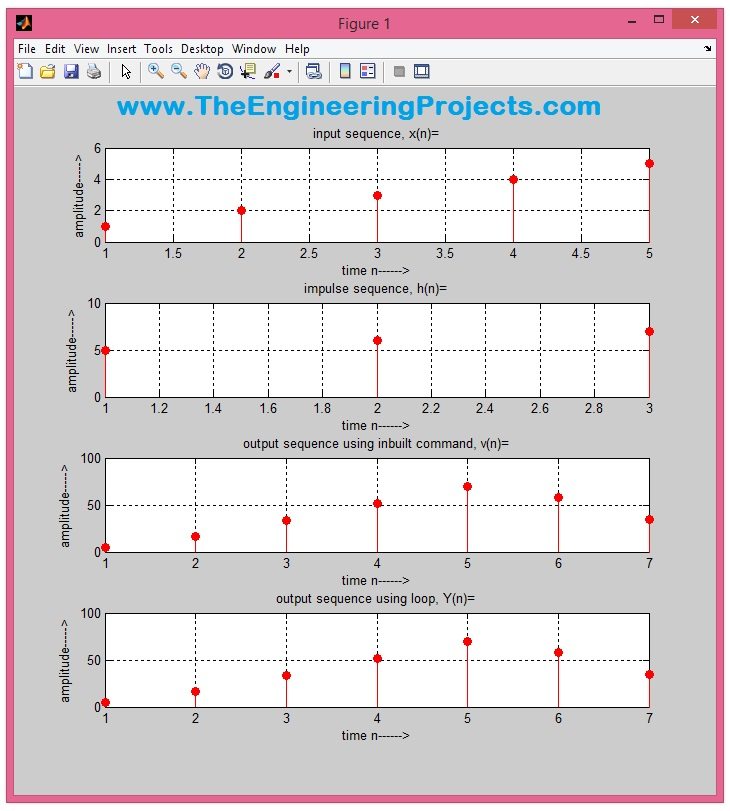
- Their graph representation is shown in the below figure:

- You can see in the above figure that we have plotted all the four signals, two inputs and two outputs and you can see both the outputs are same.
- Here's the video for this convolution calculator in MATLAB:


Reply